
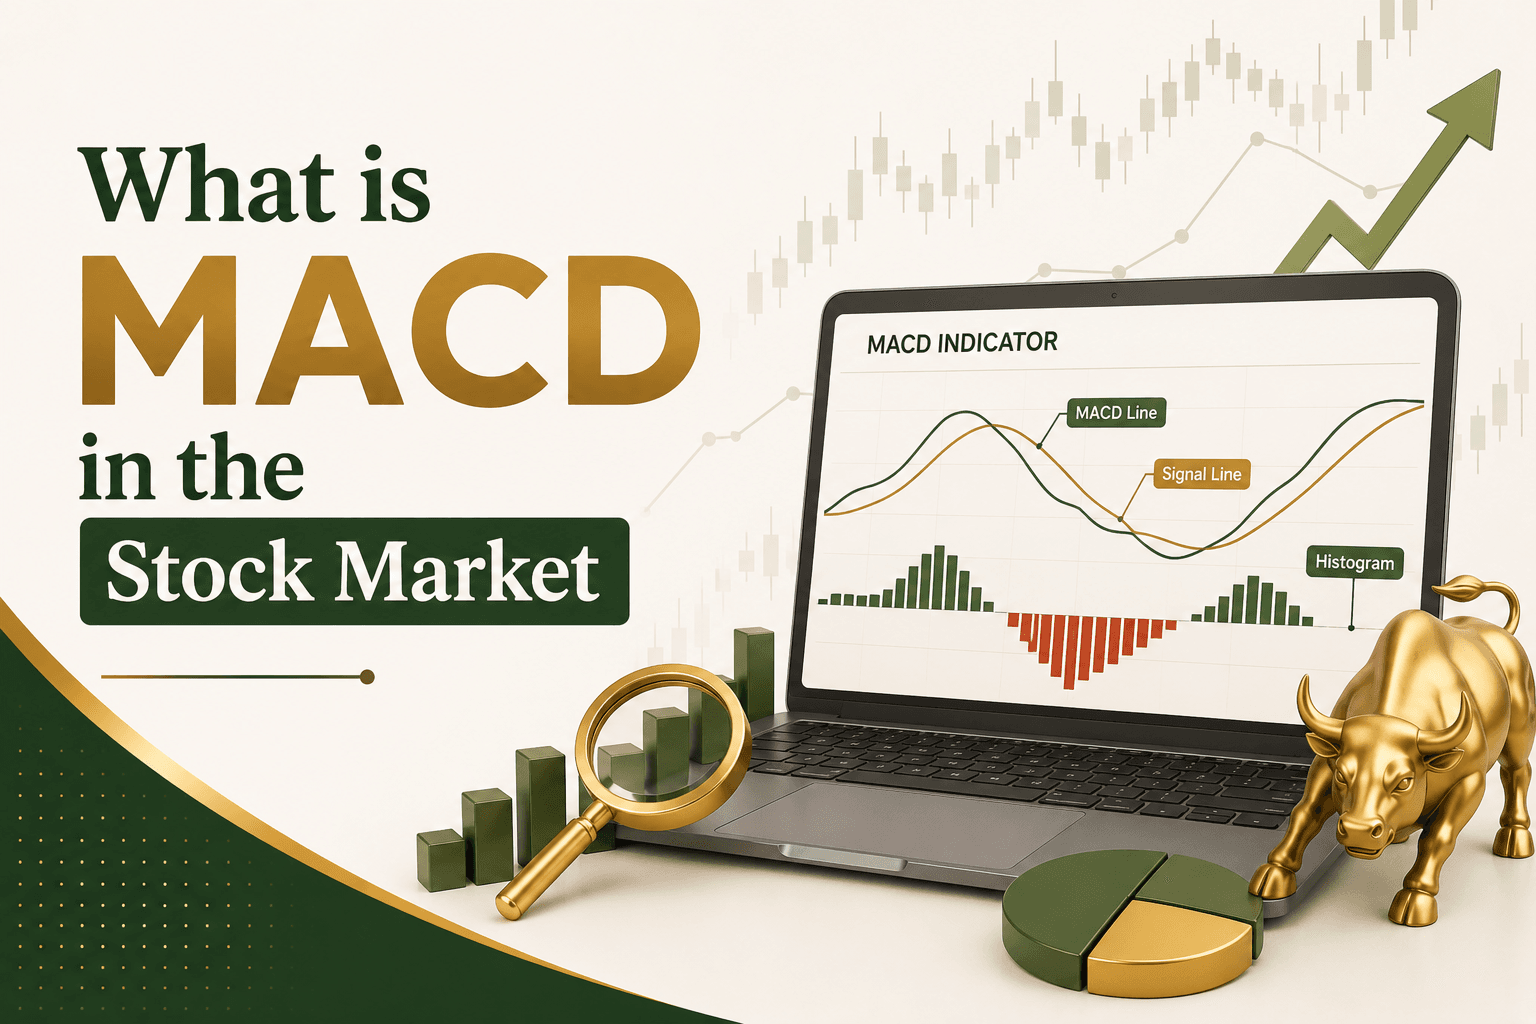
Most people who start exploring the stock market quickly realize that prices do not move randomly. There are patterns, rhythms, and shifts in momentum, and technical indicators exist to help you read them more clearly.
The MACD is one of the most trusted of these indicators. Whether you have seen it mentioned on a share market app, come across it in a trading article, or heard it in a financial discussion, understanding what MACD actually is can make a meaningful difference in how you interpret price movements.
This blog explains MACD from the ground up - what it is, where it came from, what its components mean, and why so many traders across the world continue to rely on it.
What Is MACD?
MACD stands for Moving Average Convergence Divergence.
At its core, MACD is a technical indicator, a tool used to analyze price data and identify patterns in how a stock or asset is moving. Specifically, it measures the relationship between two moving averages of a stock's price to reveal changes in momentum, direction, and the potential strength of a trend.
The name itself tells you what it does:
- Moving Average: It is built on moving averages, which smooth out price data over a set period
- Convergence: When the two moving averages come closer together
- Divergence: When they move further apart
When moving averages converge or diverge, it signals something meaningful about the shift in price momentum, and that is what MACD is designed to capture.
In the context of the stock market, MACD is classified as a trend-following momentum indicator. It does not predict price movements; it analyses existing price data to help traders identify where a trend may be heading.
A Brief History of MACD
MACD was developed by Gerald Appel, a technical analyst and author, in the late 1970s. His goal was to create a straightforward, reliable tool that could capture both the direction and momentum of a price trend, without being overly complex.
Thomas Aspray later added the histogram component in 1986, which made the indicator even more visually intuitive by showing the gap between the MACD line and its Signal line as bars on a chart.
Decades later, MACD remains one of the most widely used technical indicators in the world, a testament to how well the original concept holds up across different markets and time periods.
Understanding Moving Averages: The Foundation of MACD
Before going further, it helps to understand Exponential Moving Averages (EMAs), since MACD is built on them.
A moving average smooths out price data by calculating the average price of a stock over a specific number of periods (days, hours, weeks, etc.). This removes short-term noise and makes the underlying trend easier to see.
An Exponential Moving Average gives more weight to recent prices compared to older ones. This makes EMAs more responsive to new price information than a simple moving average.
MACD uses two EMAs:
- A faster EMA (12-period) - reacts quickly to recent price changes
- A slower EMA (26-period) - reflects a longer-term average of prices
The relationship between these two EMAs forms the backbone of the MACD indicator.
The Three Components of MACD
MACD, as displayed on most share market apps and charting platforms, has three distinct parts:
1. The MACD Line:
MACD Line = 12-period EMA − 26-period EMA
This is the primary line. When the 12-period EMA is above the 26-period EMA, the MACD line is positive, suggesting upward momentum. When it falls below, the MACD line turns negative, suggesting downward momentum.
The further the MACD line moves from zero, the stronger the momentum in that direction.
2. The Signal Line:
Signal Line = 9-period EMA of the MACD Line
The Signal line is a slower-moving average of the MACD line itself. It acts as a reference point; when the MACD line crosses above or below it, traders interpret this as a potential shift in momentum.
Think of it as the MACD's own "trend line."
3. The Histogram:
Histogram = MACD Line − Signal Line
The histogram displays the gap between the MACD line and the Signal line as vertical bars:
- Bars above zero → MACD is above the Signal line (bullish momentum)
- Bars below zero → MACD is below the Signal line (bearish momentum)
- Growing bars → momentum is increasing
- Shrinking bars → momentum is fading
The histogram makes it easier to spot changes in momentum at a glance, a key reason Aspray's addition became standard on virtually every platform.
What Does MACD Tell You?
MACD answers a few fundamental questions about a stock's price behavior:
1. Is momentum currently bullish or bearish?
If the MACD line is positive (above zero), upward momentum is present. If it is negative, downward momentum dominates.
2. Is momentum strengthening or weakening?
Expanding histogram bars indicate strengthening momentum. Contracting bars suggest it is fading, which can be an early sign of a potential trend change.
3. Is a trend change likely?
When the MACD line crosses the Signal line, or when there is a divergence between MACD and price, it may indicate that the current trend is losing strength and a reversal could be approaching.
MACD vs. Simple Moving Average: What Is the Difference?
A common question is how MACD differs from a simple moving average (SMA).
| Feature | Simple Moving Average (SMA) | MACD |
| What it shows | Average price over a period | Relationship between two EMAs |
| Sensitivity | Less responsive to recent prices | More responsive (uses EMAs) |
| Signal type | Trend direction | Momentum + trend direction |
| Visual output | A single line on the price chart | A separate panel with three components |
SMA smooths price data and helps identify the trend. MACD goes a step further by measuring how that trend is evolving, whether it is gaining or losing energy.
Why Is MACD So Widely Used?
There are a few reasons MACD has stood the test of time as a core tool in technical analysis:
- It combines two types of analysis: MACD captures both trend direction (through moving averages) and momentum (through the rate of change between them). Most indicators do one or the other.
- It is visual and intuitive: The histogram makes it relatively easy to see momentum changes at a glance, even for those newer to share market investment.
- It works across markets and timeframes: MACD is used for equities, indices, currencies, commodities, and more. It can be applied on intraday charts as well as weekly or monthly charts.
- It is widely available: Almost every share market app, brokerage platform, and charting tool includes MACD as a built-in indicator, often with no setup required.
Limitations of MACD: What It Cannot Do
Being informed about MACD means understanding its limitations just as much as its strengths.
- It is a lagging indicator: MACD is based entirely on historical price data, which means its signals appear after a price movement has already begun. It confirms trends rather than predicting them.
- It can produce false signals in sideways markets: MACD performs best when there is a clear trend. In a ranging or consolidating market, crossovers can occur frequently without meaningful follow-through.
- It should not be used in isolation: No single indicator is sufficient for making investment decisions. MACD works best as one part of a broader analytical framework that includes other indicators, price action, and fundamental research.
A Quick Visual Guide to Reading MACD
Here is what to look for when you open a MACD chart on any share market app or trading platform:
| What You See | What It May Indicate |
| MACD line above zero | Short-term upward momentum |
| MACD line below zero | Short-term downward momentum |
| MACD crosses above Signal line | Potential bullish shift |
| MACD crosses below Signal line | Potential bearish shift |
| Histogram bars growing | Momentum increasing |
| Histogram bars shrinking | Momentum weakening |
| Price rising, MACD falling | Bearish divergence - trend may weaken |
| Price falling, MACD rising | Bullish divergence - trend may reverse |
Is MACD Relevant for Long-Term Investors?
MACD is most commonly associated with short to medium-term trading - swing trading, intraday trading, and position trading. For long-term investors whose approach to stock market investment is built on fundamentals (earnings growth, valuations, sector outlook), MACD plays a smaller role.
That said, even long-term investors can find value in MACD when deciding on entry timing. Viewing MACD on a weekly chart rather than a daily one strips away much of the noise and provides a broader view of whether momentum supports entering a position at a particular time.
It is one more layer of information, not a decision-making tool in isolation.


