
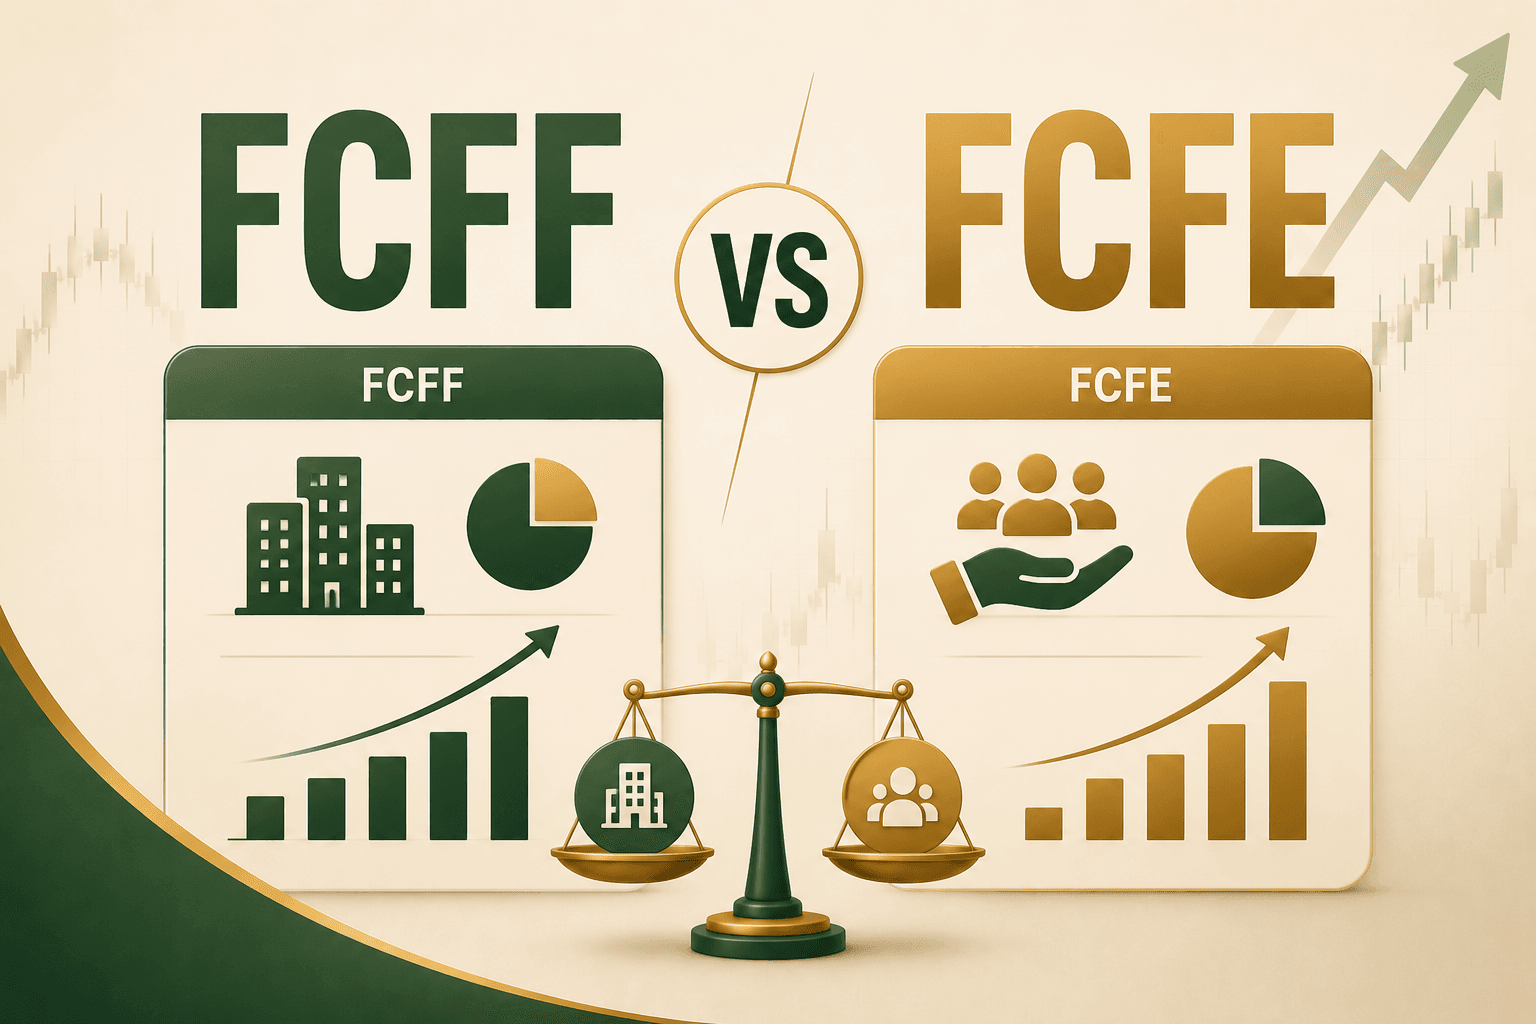
When you start digging into company valuation, you'll quickly run into two terms that sound similar but mean very different things: Free Cash Flow to Firm (FCFF) and Free Cash Flow to Equity (FCFE). Both measure how much cash a business generates, but they answer different questions; one looks at cash available to everyone who has financed the company, and the other looks at cash available only to shareholders.
If you're serious about investment in the share market, understanding this distinction isn't just academic. It directly affects how analysts value stocks, how discounted cash flow (DCF) models are built, and ultimately, what a fair price for a stock might look like.
This guide breaks down FCFF vs FCFE, shows you how to calculate FCFE from FCFF, and explains why this matters for anyone doing share market investment.
What Is Free Cash Flow to Firm (FCFF)?
FCFF represents the cash a company generates from its operations after accounting for operating expenses, taxes, and reinvestment needs (like capital expenditure and working capital changes), but before paying anyone who has a financial claim on the business, including both lenders and shareholders.
In simple terms, FCFF answers: "How much cash does the business produce for all its capital providers combined?"
FCFF formula (starting from EBIT):
FCFF = EBIT × (1 − Tax Rate) + Depreciation & Amortization − Capital Expenditure − Change in Working Capital
Because FCFF is calculated before interest payments, it's considered a "capital structure neutral" measure; it doesn't matter whether the company is funded mostly by debt or mostly by equity, FCFF stays the same. This is why analysts often prefer FCFF when comparing companies with different debt levels.
What Is Free Cash Flow to Equity (FCFE)?
FCFE narrows the focus. It measures the cash left over specifically for equity shareholders, after the company has met its operating expenses, reinvestment needs, and obligations to debt holders (interest payments and net debt repayments).
FCFE formula (starting from Net Income):
FCFE = Net Income + Depreciation & Amortization − Capital Expenditure − Change in Working Capital + Net Borrowing
FCFE tells you what's genuinely available to be paid out to shareholders, whether as dividends, buybacks, or simply retained for growth. This makes it a more direct measure for equity valuation.
FCFF vs FCFE: Key Differences
| Aspect | FCFF | FCFE |
| Who it's for | All capital providers (debt + equity holders) | Equity shareholders only |
| Starting point | EBIT (or EBITDA) | Net Income |
| Debt treatment | Excludes interest and debt flows | Includes interest expense impact and net borrowing |
| Capital structure | Independent of capital structure | Sensitive to capital structure (leverage) |
| Discount rate used in valuation | WACC (Weighted Average Cost of Capital) | Cost of Equity |
| Best used when | Comparing firms with different debt levels, or valuing the whole enterprise | Valuing equity directly, especially when capital structure is stable |
| Output of DCF model | Enterprise Value | Equity Value |
The core distinction comes down to this: FCFF is a "pre-financing" number, while FCFE is a "post-financing" number. FCFF tells you what the whole business generates; FCFE tells you what's left for shareholders after debt-related obligations are settled.
How to Calculate FCFE from FCFF?
One of the most practical skills in equity research is converting FCFF into FCFE, since many valuation models start with FCFF and need to be adjusted for equity investors. Here's the standard link between the two:
FCFE = FCFF − Interest Expense × (1 − Tax Rate) + Net Borrowing
Let's break this down:
- Start with FCFF - the total cash generated for all capital providers.
- Subtract after-tax interest expense - this removes the portion of cash that belongs to debt holders.
- Add net borrowing - this accounts for new debt raised (which increases cash available to equity holders) or debt repaid (which reduces it).
This FCFE and FCFF formula relationship is useful because many financial databases and analyst reports report FCFF more consistently than FCFE, so knowing how to derive one from the other saves time and keeps your valuation model internally consistent.
Why This Matters for Share Market Investment?
You might wonder why a retail investor, not just an analyst building spreadsheets, should care about FCFF and FCFE. Here's the practical relevance:
1. It affects valuation models: DCF valuation, one of the most widely used methods for estimating a stock's intrinsic value, relies on either FCFF or FCFE. Knowing which one is being used, and what discount rate goes with it, helps you sanity-check research reports and analyst recommendations rather than accepting price targets at face value.
2. It reveals a company's real cash-generating ability: Net income can be influenced by accounting choices, one-off items, or non-cash adjustments. Free cash flow, whether FCFF or FCFE, strips away much of that and shows the actual cash a business is generating, a cleaner signal for long-term stock market analysis.
3. It highlights capital structure risk: A company with strong FCFF but weak FCFE (because of heavy debt servicing) is telling you something important: shareholders are getting a smaller share of the pie relative to lenders. This is a useful red flag when comparing two companies in the same sector.
4. It supports better long-term decisions: Whether you're evaluating a large-cap or researching a smaller company before adding it to your portfolio, understanding free cash flow dynamics helps you look past short-term price movements and focus on fundamentals, a healthier approach to share market investment overall.
Putting This Into Practice
If you're using a share market app to research stocks, many platforms now surface free cash flow metrics alongside standard ratios like P/E or P/B. When you see these numbers, it helps to ask:
- Is this FCFF or FCFE being reported?
- How leveraged is the company, and how might that affect the gap between the two?
- Is free cash flow growing consistently, or is it volatile?
These questions add depth to your analysis and move you beyond surface-level metrics.


