
The stock market generates an enormous amount of data every single trading day, including price movements, volumes, breadth readings, and dozens of other signals. For anyone serious about investment in the share market, making sense of all this noise is one of the biggest challenges. That is where technical indicators come in, and few are underappreciated as the TRIN indicator.
Whether you are a seasoned trader or someone who has just started exploring share market investments, understanding the TRIN indicator can give you a meaningful edge in reading the market’s mood.
The blog breaks it all down - what is TRIN, how it works, how to read it, and how you can use it wisely.
What is the TRIN Indicator?
TRIN stands for Trading Index. It is also widely known as the Arms Index, named after Richard Arms, who developed it in 1967. Despite being over five decades old, it remains one of the most reliable breadth indicators used in technical analysis today.
At its core, TRIN measures the relationship between the number of advancing and declining stocks and the volume associated with each group. It is a market breadth indicator, which means it looks beyond individual stock prices and examines the overall health and momentum of the broader market.
The TRIN Formula: How Is It Calculated?
The formula might look intimidating at first, but it is actually quite straightforward once you break it down:
TRIN = (Advancing Issues / Declining Issues) ÷ (Advancing Volume / Declining Volume)
Let us decode each component:
- Advancing Issues: The number of stocks that have moved up during a trading session
- Declining Issues: The number of stocks that have moved down
- Advancing Volume: The total trading volume in stocks that are advancing
- Declining Volume: The total trading volume in stocks that are declining
The result is a ratio. And the interpretation of that ratio is where things get really interesting.
Note: While traditionally calculated using share volume, many Indian trading platforms use traded value or turnover in Rupees to calculate this ratio, which provides an even more accurate picture.
How to Read the TRIN Value?
The TRIN indicator is one of those tools that is counter-intuitive when you first encounter it. Here is how to interpret the values:
| TRIN Value | What It Suggests |
| Below 1.0 | Bullish signal - volume is concentrated in advancing stocks |
| Exactly 1.0 | Neutral - advancing and declining volumes are balanced |
| Above 1.0 | Bearish signal - volume is concentrated in declining stocks |
| Above 2.0 | Oversold territory - potential market reversal upward |
| Below 0.5 | Overbought territory -market may be due for a pullback |
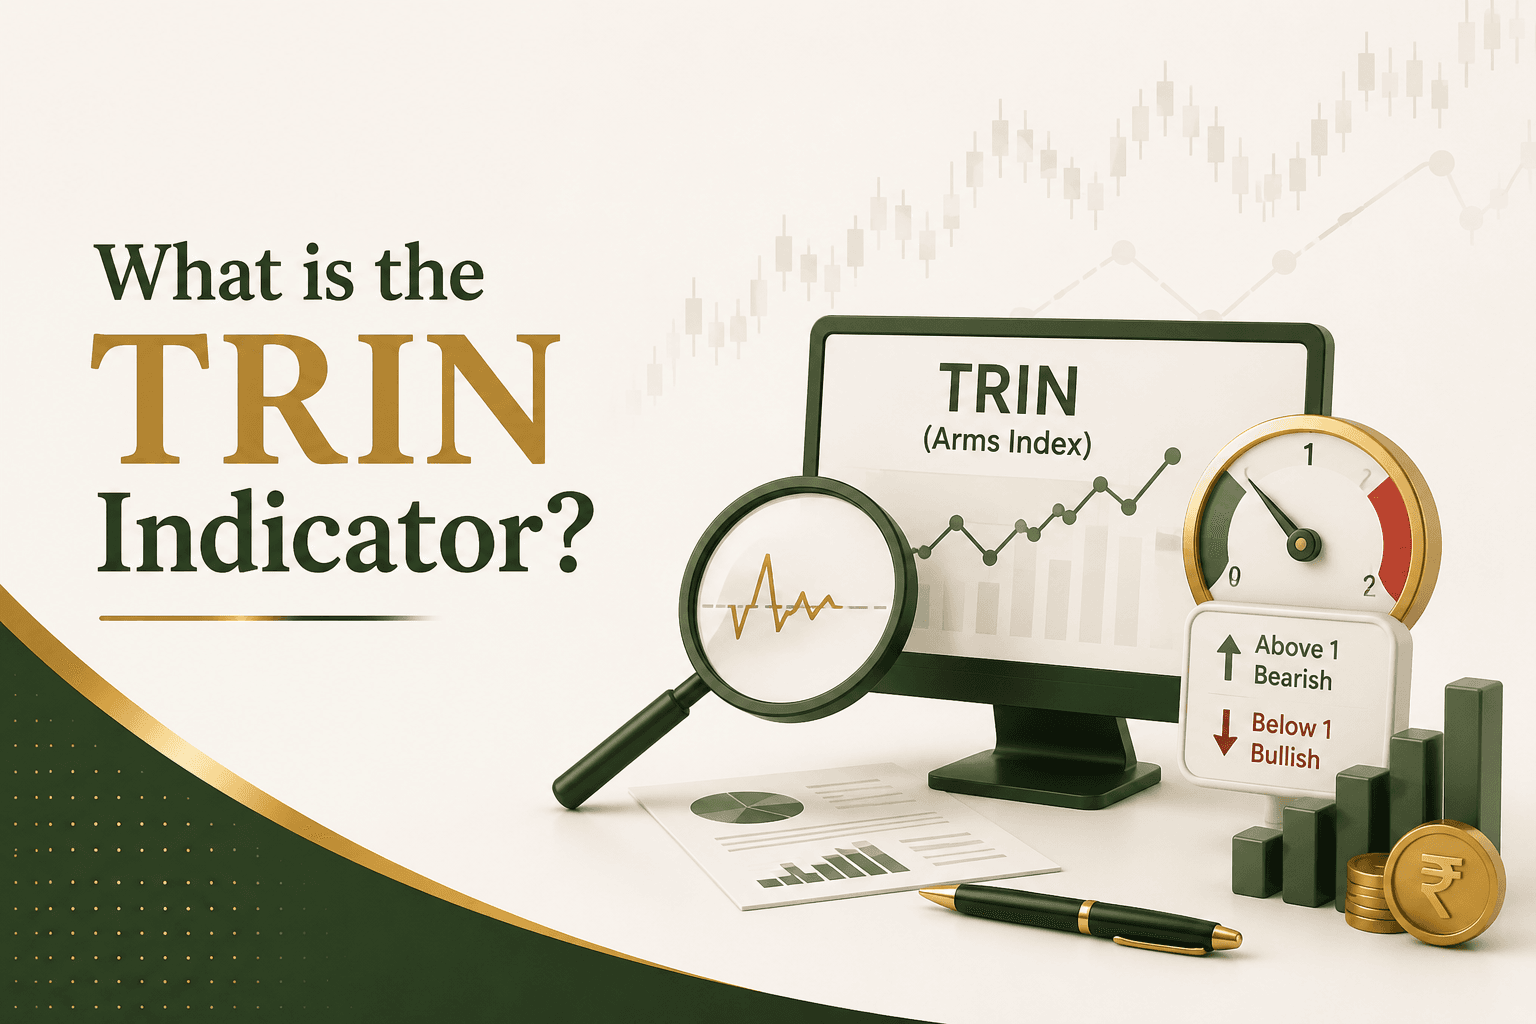
Here is the counter-intuitive part: a low TRIN reading (below 1) is bullish, and a high TRIN reading (above 1) is bearish. This trips up many beginners.
Think of it this way: if advancing stocks are attracting heavy volume, it shows strong buying conviction. That pushes the advancing volume ratio higher and therefore pushes the overall TRIN value lower. So a lower number actually reflects more enthusiasm among buyers.
Note: TRIN can stay "overbought" or "oversold" for extended periods. It is best used alongside other indicators to confirm a turn.
A Practical Example
Suppose on a given trading day:
- 1,800 stocks advance, 700 decline
- Advancing volume = 900 million shares
- Declining volume = 200 million shares
Advance/Decline Ratio = 1800 ÷ 700 = 2.57
Advancing/Declining Volume Ratio = 900 ÷ 200 = 4.5
TRIN = 2.57 ÷ 4.5 = 0.57
A TRIN of 0.57 would indicate a strongly bullish day: a large number of stocks are advancing, and they are drawing in heavy volume. Buyers are in clear control.
Why TRIN Is Different from Price-Based Indicators?
Most investors who start their share market investment journey focus entirely on price. They look at moving averages, RSI, MACD, and other price-driven tools. These are valuable, but they only tell one part of the story.
TRIN adds the volume dimension to market breadth. Price alone can sometimes be misleading. For instance, an index like the Nifty 50 or Sensex can move up on a given day even if only a handful of heavyweight stocks are driving the gains while the majority of stocks are actually declining. TRIN captures that divergence.
This is what makes TRIN especially useful for investors who track the broader stock market rather than just a handful of large-cap names.
Intraday vs. End-of-Day TRIN
TRIN can be monitored in two ways:
1. Intraday TRIN:
This is the real-time reading throughout the trading day. Intraday TRIN fluctuates quite significantly and can be volatile. Short-term traders often watch the 10-day or 5-day moving average of TRIN to smooth out the noise rather than reacting to every tick.
2. Closing TRIN:
This is the TRIN reading at the end of the trading session. It is more stable and is often used by analysts who are trying to assess the broader market trend over days or weeks.
Many professional traders prefer to use a 10-day moving average of TRIN (sometimes called the TRIN-10) to get a smoother picture of market sentiment.
Common TRIN Trading Signals to Watch For
1. Extreme Readings Signal Reversals:
When TRIN spikes above 2.0 or even 3.0, it often signals that the market has been sold off aggressively in the short term and may be due for a bounce. Conversely, when TRIN stays unusually low (under 0.5) for a sustained period, it can suggest the market is overbought.
These extreme readings don't guarantee a reversal, but they do shift the odds in a certain direction, which is all any technical indicator can do.
2. Divergence Between TRIN and Price:
One of the most powerful signals is when the market index moves higher, but TRIN is also rising (bearish). This suggests the rally is narrow and not supported by broad participation. Divergences like these often precede corrections.
3: Trend Confirmation:
When the index is trending upward, and TRIN stays consistently below 1.0 during that rally, it confirms that the move is broad-based and healthy. This is a sign of genuine strength in the stock market, not just a few large stocks lifting the index.
Limitations of the TRIN Indicator
No indicator is perfect, and TRIN has its own set of limitations that every investor should keep in mind.
1. It can be noisy intraday:
The real-time TRIN value can swing dramatically within a single trading session. Relying on it without smoothing (such as a moving average) can lead to false signals.
2. It doesn't work as well in low-volume conditions:
On days with unusually low overall market volume, for example, sessions before a major holiday, the TRIN readings can become unreliable.
3. It is a broad-market tool:
TRIN reflects the overall market sentiment and is not suitable for analysis of individual stocks. If you are evaluating a specific company's prospects, TRIN is not the right tool for the job.
4. Best used alongside other indicators:
Like most technical tools, TRIN should not be used in isolation. It works best when combined with other breadth indicators (like the Advance-Decline Line), volume analysis, and price-based indicators.
TRIN in the Context of Indian Markets
While TRIN originated in U.S. markets and is most commonly associated with the NYSE (New York Stock Exchange), the underlying concept applies to any exchange with sufficient breadth data, including the NSE (National Stock Exchange) and BSE (Bombay Stock Exchange) in India.
Traders who are active in Indian equity markets and use a share market app for their daily tracking should check whether their chosen platform provides breadth indicators alongside price data. As data availability improves across platforms, more retail investors in India are now able to incorporate market breadth analysis into their decision-making process.
Practical Guidelines for Using TRIN Effectively
Here are a few practical guidelines if you plan to incorporate TRIN into your analysis:
- Smooth it out: Use a 5-day or 10-day moving average of TRIN rather than relying on single-day readings.
- Look for extremes: TRIN is most useful at its extremes. A reading of 2.5 or higher is worth paying attention to. So is a sustained reading below 0.5.
- Combine it with the Advance-Decline Line: These two indicators complement each other well. The AD Line shows the cumulative breadth trend; TRIN adds the volume dimension.
- Don't ignore the context: A TRIN reading of 1.5 during a broader bull market means something different from a reading of 1.5 during a prolonged bear market.
- Use it for market timing, not stock selection: TRIN tells you about the market's overall health. Use it to gauge risk appetite across the market, not to decide which individual stock to buy.
Who Should Pay Attention to TRIN?
TRIN is particularly useful for:
- Index traders and futures traders who want a read on overall market direction
- Swing traders looking for short-term reversal setups based on overbought or oversold conditions
- Long-term investors who want to time their entry and exit points more thoughtfully during volatile phases
- Anyone involved in share market investment who wants to go beyond surface-level price analysis
Even if you are a relatively passive investor who uses a share market app primarily to track your portfolio, understanding TRIN can help you make more informed decisions when markets are unusually choppy or trending strongly in one direction.
TRIN vs. Other Market Breadth Indicators
It helps to understand how TRIN fits into the broader toolkit of breadth indicators:
| Indicators | What it Measures | Volume Included |
| Advance-Decline Line | Cumulative difference between advancing and declining stocks | No |
| TRIN (Arms Index) | Ratio of A/D issues to A/D volume | Yes |
| McClellan Oscillator | Smoothed version of the A/D data | No |
| Up/Down Volume Ratio | Ratio of up volume to down volume | Yes |
TRIN is unique because it combines both breadth (number of stocks) and volume into a single, easy-to-read number. That dual perspective is what sets it apart.
Final Thoughts
The TRIN indicator may not grab headlines the way earnings reports or interest rate decisions do, but for investors who want a deeper understanding of what the stock market is really doing beneath the surface, it is an invaluable tool. It bridges the gap between price movement and the actual buying and selling conviction driving that movement.
As with all analytical tools, the goal is not to find one magic indicator; it is to build a coherent picture using multiple signals. TRIN is an excellent addition to that picture, especially for those who take their share market investment seriously and want to move beyond price charts alone.
Start observing TRIN readings alongside the market's daily moves. Over time, you will begin to develop an intuitive understanding of what the numbers are telling you, and that kind of market literacy is genuinely hard to replicate.


