
Anyone who has spent time studying price charts has likely come across candlestick patterns that seem to repeat themselves at key turning points. One of the most widely recognised of these is the engulfing pattern. It's a two-candle formation that many traders and analysts watch closely because it often appears just before a shift in market direction.
If you're building your understanding of technical analysis as part of your investment in the share market, learning to recognize this pattern is a useful step. This blog breaks down what the engulfing candlestick pattern is, how it forms, what it may indicate, and how it's typically used, so you can approach your own share market investment decisions with a clearer, more informed perspective.
What Is an Engulfing Pattern?
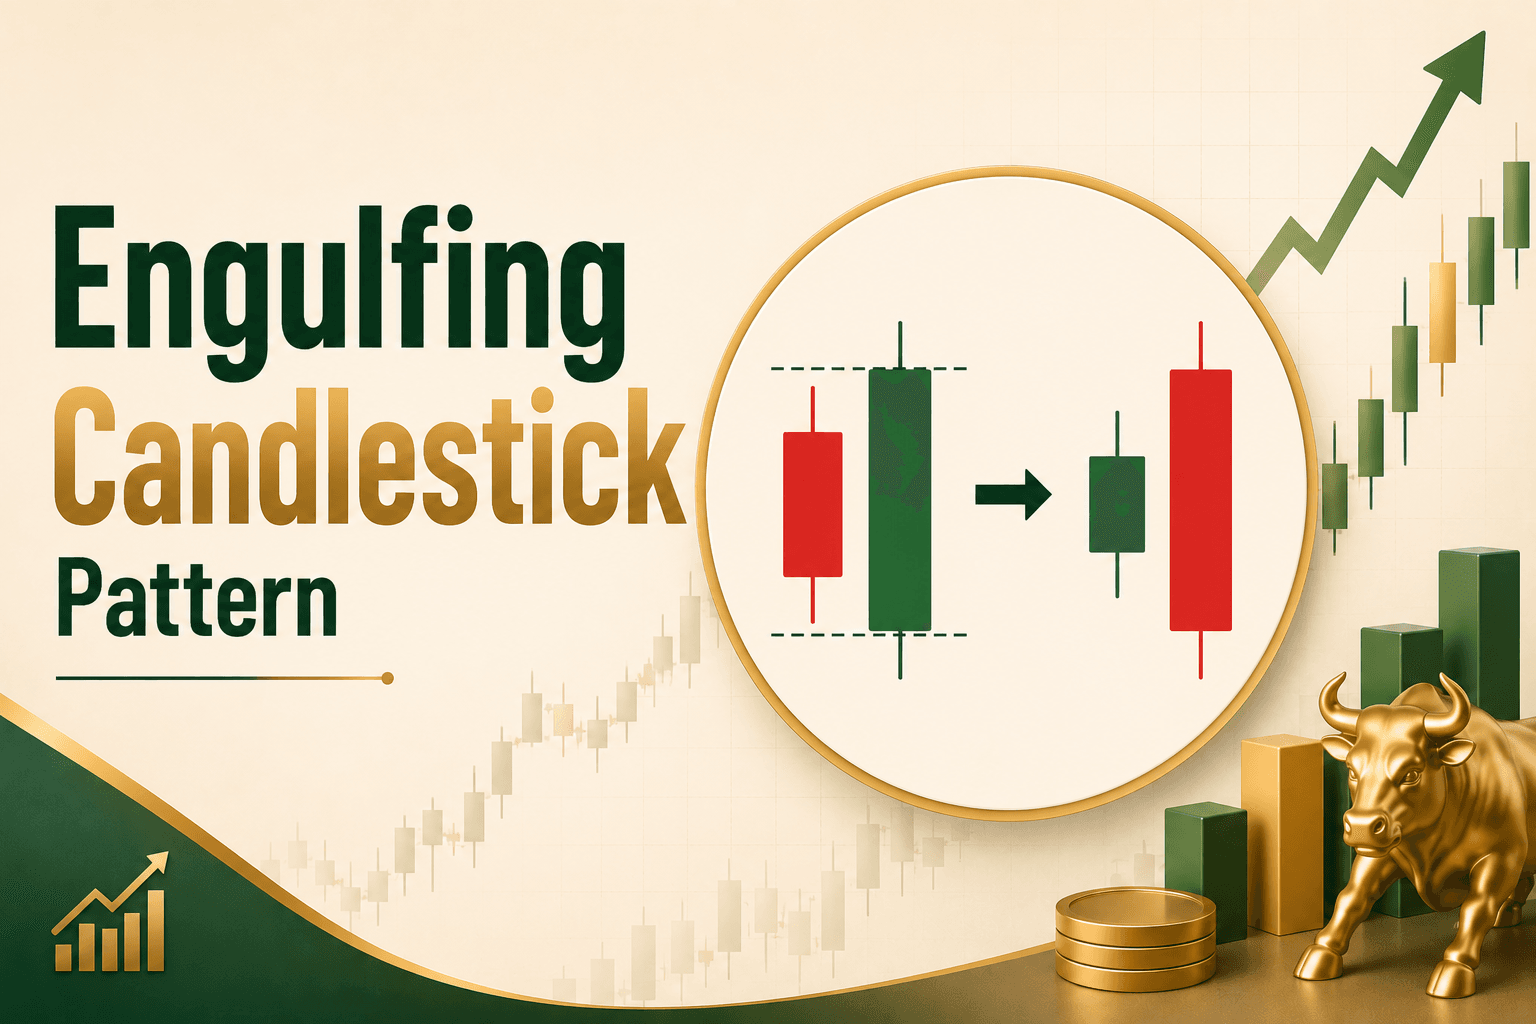
An engulfing pattern is a two-candle chart formation where the body of the second candle completely covers, or "engulfs," the body of the candle before it. This pattern can appear on any timeframe - intraday charts, daily charts, or weekly charts - and is used across various markets, including equities, commodities, and currencies.
The engulfing pattern is considered a reversal signal, meaning it often shows up after a sustained move in one direction and may suggest that the momentum is shifting. It's important to note that a single pattern doesn't guarantee a reversal will happen; it simply reflects a change in the balance between buyers and sellers at that point in time.
There are two variations of this formation: the bullish engulfing pattern and the bearish engulfing pattern.
Bullish Engulfing Pattern
A bullish engulfing pattern typically forms after a downtrend. It consists of:
- A smaller red (or bearish) candle, showing that sellers were in control.
- A larger green (or bullish) candle that follows, whose body completely covers the body of the previous red candle.
This sequence suggests that buyers have stepped in with enough strength to absorb the selling pressure and push prices higher. Some market participants view this as an early sign that a downtrend may be losing steam and that buyers could be gaining the upper hand.
Bearish Engulfing Pattern
A bearish engulfing pattern is the mirror image and generally appears after an uptrend. It consists of:
- A smaller green (or bullish) candle, indicating buyers were driving prices up.
- A larger red (or bearish) candle that follows, with a body that fully covers the previous green candle's body.
This pattern indicates that sellers have overwhelmed the buying interest, and it's often interpreted as an early signal that an uptrend could be running out of momentum.
Why the Engulfing Candle Pattern Matters to Traders and Investors?
The engulfing candle pattern is popular for a few reasons:
- It's easy to identify. Unlike some complex chart formations, this pattern only requires two candles, making it simple to spot once you know what to look for.
- It reflects a shift in sentiment. Because the pattern shows one side of the market (buyers or sellers) overpowering the other, it gives a visual sense of changing sentiment.
- It's often used alongside other tools. Experienced chart readers rarely rely on a single candlestick pattern in isolation. The engulfing pattern gains significant conviction when it forms precisely at a major historical support or resistance zone, or right as the price touches a key dynamic indicator like the 50-day or 200-day Moving Average. Combining the pattern with these levels helps filter out false signals.
Factors That Can Strengthen or Weaken the Signal
Not every engulfing pattern carries the same weight. A few factors that market participants often consider include:
- Trend context: The pattern is generally considered more meaningful when it appears after a clear, extended trend rather than in a sideways or choppy market.
- Volume: Higher trading volume on the engulfing candle is sometimes seen as adding conviction to the move, since it suggests wider participation.
- Location on the chart: A pattern forming near a known support or resistance zone may be viewed differently than one forming in the middle of a trading range.
- Size of the engulfing candle: A candle that engulfs the prior one by a wide margin is sometimes viewed as a stronger signal than one that barely covers it.
A Note on Modern Charts: While classic textbook definitions state that the second candle must open with an overnight gap past the first candle's body, in modern electronic markets, prices often open exactly where they closed. In practice, as long as the second candle's body clearly outgrows and covers the first, traders consider the signal valid.
A Word of Caution
Like all technical analysis tools, the engulfing pattern is not a guaranteed predictor of future price movement. Markets are influenced by a wide range of factors, including company fundamentals, economic data, global events, and overall investor sentiment. A pattern that has historically preceded a reversal may not always play out the same way in future instances.
This is why the engulfing pattern is best treated as one input among many, rather than a standalone trading signal. Anyone considering an investment in the share market should take the time to understand their own risk appetite, financial goals, and time horizon, and, where appropriate, consult a qualified financial advisor before making investment decisions. Past patterns and historical performance are not indicative of future results, and all stock market investments carry risk, including the potential loss of principal.
Final Thoughts
The engulfing pattern remains one of the more approachable concepts in technical analysis, largely because of its straightforward, two-candle structure. Whether it's a bullish engulfing pattern signalling potential buying interest after a downtrend, or a bearish engulfing pattern hinting at selling pressure after an uptrend, the underlying idea is the same: a visible shift in the tug-of-war between buyers and sellers.
For those building their knowledge of the stock market, understanding patterns like this can add another layer to how you read price charts. But as with any tool in technical analysis, it works best when combined with broader research, sound risk management, and a clear understanding of your own investment objectives.


