
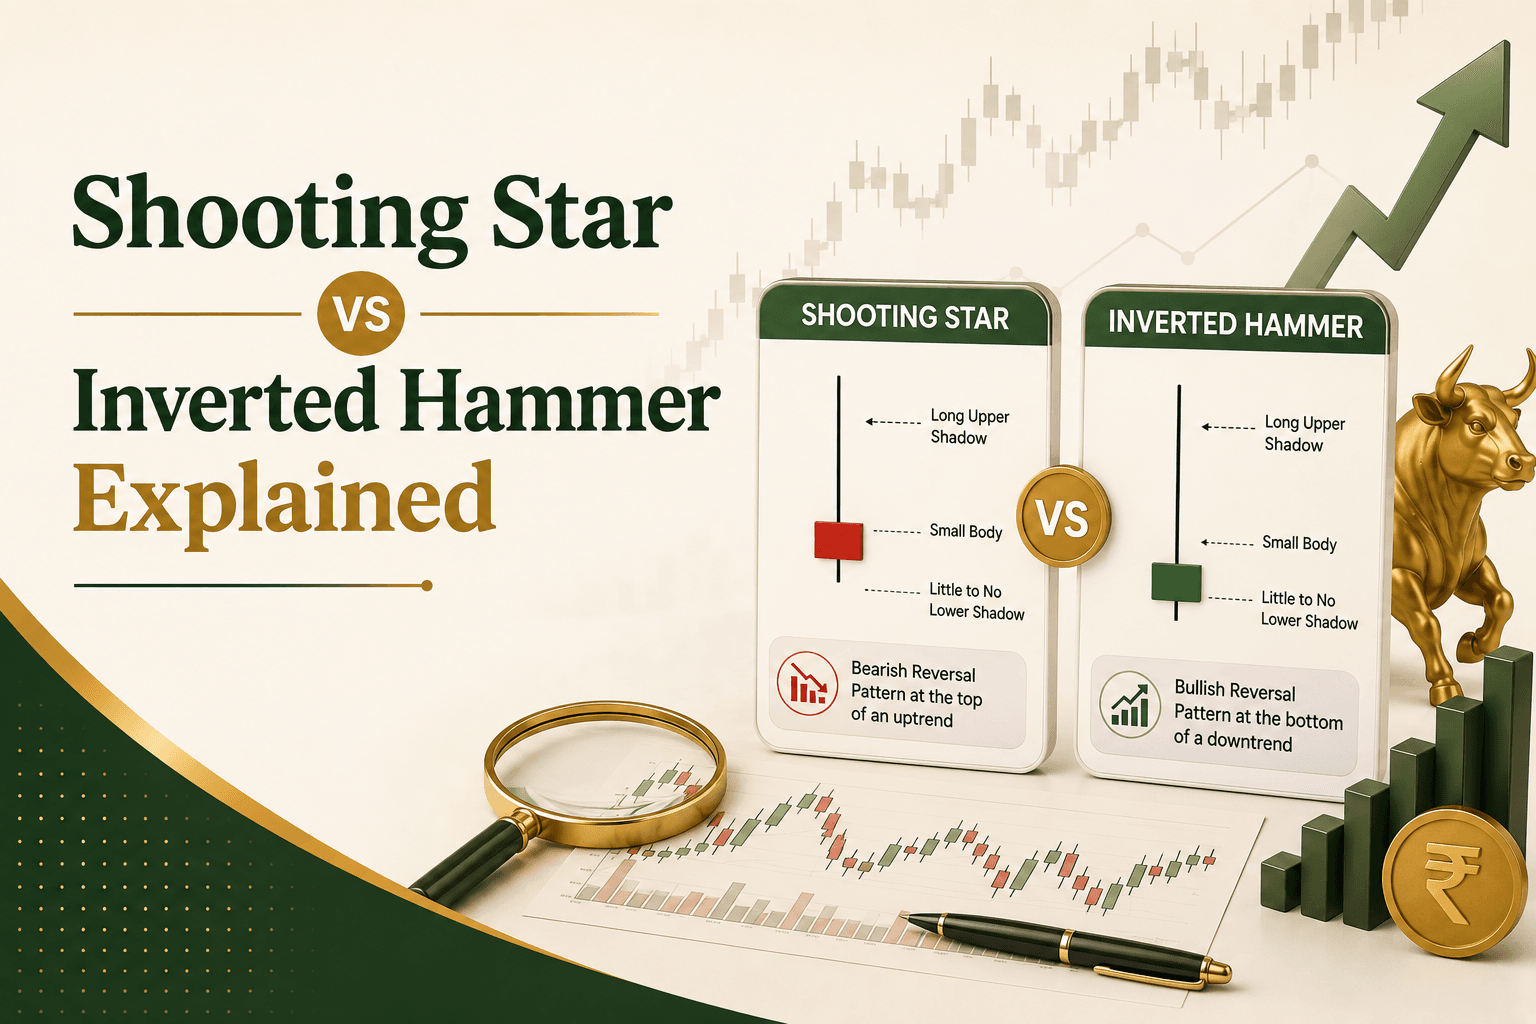
If you have spent any time reading candlestick charts on a share market app or studying technical analysis, you have probably come across two patterns that look almost identical: the shooting star and the inverted hammer. Same shape, same dramatic silhouette, yet they carry opposing messages for traders and investors.
Confusing these two patterns can lead to costly mistakes. This guide breaks them down clearly, explains what each one signals, and shows you how to tell them apart so you can use them more confidently in your investment in the share market.
Quick Summary
- The inverted hammer and shooting star look the same but mean opposite things.
- The inverted hammer appears after a downtrend and hints at a potential bullish reversal.
- The shooting star appears after an uptrend and hints at a potential bearish reversal.
- Context is everything; always identify the prevailing trend before labeling a pattern.
- Both require confirmation from the next session's price action.
- Use these signals in combination with other tools for better reliability in your stock market analysis.
What Is a Candlestick Pattern?
Before diving into the comparison, a quick primer. A candlestick represents price movement over a defined period: a day, an hour, a week. It shows four data points: the open, close, high, and low price.
The "body" of the candle is the range between open and close. The thin lines extending above and below are called "wicks" or "shadows." When a candle has a long upper shadow and a small body near the bottom, it creates a distinctive shape, and that is exactly where the shooting star and inverted hammer enter the picture.
The Inverted Hammer: A Signal of Potential Reversal Upward
What It Looks Like?
The inverted hammer is a single-candlestick pattern with:
- A small real body at the lower end of the price range
- A long upper shadow (typically at least twice the length of the body)
- Little to no lower shadow
The body can be either bullish (white/green) or bearish (black/red), though a bullish body is generally considered a stronger signal.
Where It Appears?
The inverted hammer appears at the bottom of a downtrend. This placement is what gives it meaning. After a sustained period of falling prices, this pattern suggests that buyers are beginning to push back, even if sellers managed to drag prices back down by the close.
What It Signals?
The long upper wick tells a story: buyers stepped in during the session and pushed prices significantly higher, but selling pressure brought the price back near the open by the time the session closed. While this might seem like a win for sellers, the fact that buyers tried at the bottom of a downtrend is meaningful.
Traders interpret the inverted hammer as a potential bullish reversal signal, a hint that the selling momentum may be exhausted and that buyers could take control in the sessions ahead.
Important: The inverted hammer is not a confirmation signal on its own. Most technical analysts wait for a bullish candle in the next session before acting on it.
Example Scenario
Imagine a stock has been falling for several days in the stock market. On a particular day, it opens near its low, climbs sharply during the session (leaving a long upper wick), but then retreats and closes near where it opened. This is an inverted hammer. If the next day the stock opens higher and closes higher, that could confirm a reversal.
The Shooting Star: A Warning of Potential Reversal Downward
What It Looks Like?
Visually, the shooting star is nearly identical to the inverted hammer:
- A small real body at the lower end of the session's range
- A long upper shadow (again, at least twice the body length)
- Little to no lower shadow
The difference in appearance is subtle, but its context is completely opposite.
Where It Appears?
The shooting star appears at the top of an uptrend. This is the defining characteristic. The pattern is only called a shooting star when it forms after a sustained price advance.
What It Signals?
Here, the same visual story carries a different implication. Buyers pushed prices much higher during the session, but sellers overwhelmed them before the close, dragging the price back down near the open. After an uptrend, this kind of rejection at the highs is a bearish warning signal.
The shooting star suggests that the buying momentum may be weakening and that sellers are starting to gain control. It is often watched closely by traders considering an exit from long positions or a potential short entry.
Important: Like the inverted hammer, the shooting star is a signal, not a certainty. It should be confirmed by a bearish candle in the next session before taking action.
Example Scenario
A stock has been rallying for several sessions in the share market. One day, it opens near its recent lows, surges dramatically higher intraday, but then sellers push it back to close near the open. That's a shooting star. If the following session opens lower and continues to fall, the reversal signal is considered confirmed.
Shooting Star vs Inverted Hammer: Side-by-Side Comparison
Feature | Inverted Hammer | Shooting Star |
Visual shape | Small body, long upper wick, no lower wick | Small body, long upper wick, no lower wick |
Trend context | Appears after a downtrend | Appears after an uptrend |
Signal type | Bullish reversal (potential) | Bearish reversal (potential) |
Confirmation needed | Yes - bullish next candle | Yes - bearish next candle |
Body colour preference | Bullish (green/white) is stronger | Bearish (red/black) is stronger |
Trader action | Watch for buying opportunity | Watch for exit or shorting opportunity |
Risk of misreading | Can appear at mid-trend, reducing reliability | Same - context is everything |
The Single Biggest Difference: Context, Not Shape
If there is one thing to take away from this comparison, it is this: the shape alone tells you nothing. What matters is where the pattern appears within the broader price trend.
The same candle, small body, long upper wick, means something entirely different depending on whether it shows up after five days of falling prices or five days of rising prices.
This is a common source of confusion for newer investors exploring the stock market. A shooting star candlestick vs inverted hammer debate almost always comes down to trend context, not technical structure.
Common Mistakes When Using These Patterns
1. Acting without confirmation:
Both patterns are early warnings, not trading signals in themselves. Always wait for the next candle to confirm the expected move.
2. Ignoring the broader trend:
A pattern appearing mid-trend or in a ranging (sideways) market carries much less weight. These patterns are most meaningful after a sustained, clear directional move.
3. Overlooking volume:
Volume is a useful ally. If an inverted hammer forms on higher-than-usual volume, it may signal a more forceful buying attempt. Similarly, a shooting star accompanied by high volume suggests stronger selling pressure and adds conviction to the reversal signal.
4. Using candlesticks in isolation:
No pattern works perfectly on its own. Most experienced traders use candlestick signals in conjunction with support/resistance levels, moving averages, RSI, or other indicators. Share market investment decisions should ideally be based on multiple converging factors.
5. Overtrading based on single-candle patterns:
One candle does not make a trend. Patience and discipline matter more than acting on every pattern you spot on your share market app.
How Reliable Are These Patterns?
Neither pattern guarantees a reversal. Historical studies on candlestick patterns suggest they perform better when:
- Appearing near key support levels (for inverted hammer) or resistance levels (for shooting star)
- Backed by volume confirmation
- Seen on higher timeframes (daily, weekly), where noise is reduced compared to 5-minute or 15-minute charts
- Reinforced by other technical indicators pointing in the same direction
It is worth noting that in highly volatile or thinly traded stocks, these patterns can be less reliable, as price movements may be driven by fewer participants.
A Note on Risk and Compliance
Candlestick analysis is a tool, not a guarantee. All forms of technical analysis carry inherent uncertainty, and no pattern, however well-studied, predicts future prices with certainty.
Share market investment involves risk, including the possible loss of principal. Patterns like the shooting star and inverted hammer are best used as part of a broader investment or trading strategy, not as standalone buy or sell triggers.


