
Candlestick charts tell a story in every session, and few shapes capture market hesitation as clearly as the long-legged doji. If you have spent any time studying price charts, you have likely come across this pattern during periods of high volatility or right before a major trend shift. Understanding what it represents, and more importantly, what it does not guarantee, can make you a more disciplined reader of price action.
This article breaks down the long-legged doji candle in detail: how to identify it, what it signals about market psychology, how it compares to other doji variations, and how traders typically factor it into their analysis.
What Is a Long-Legged Doji?
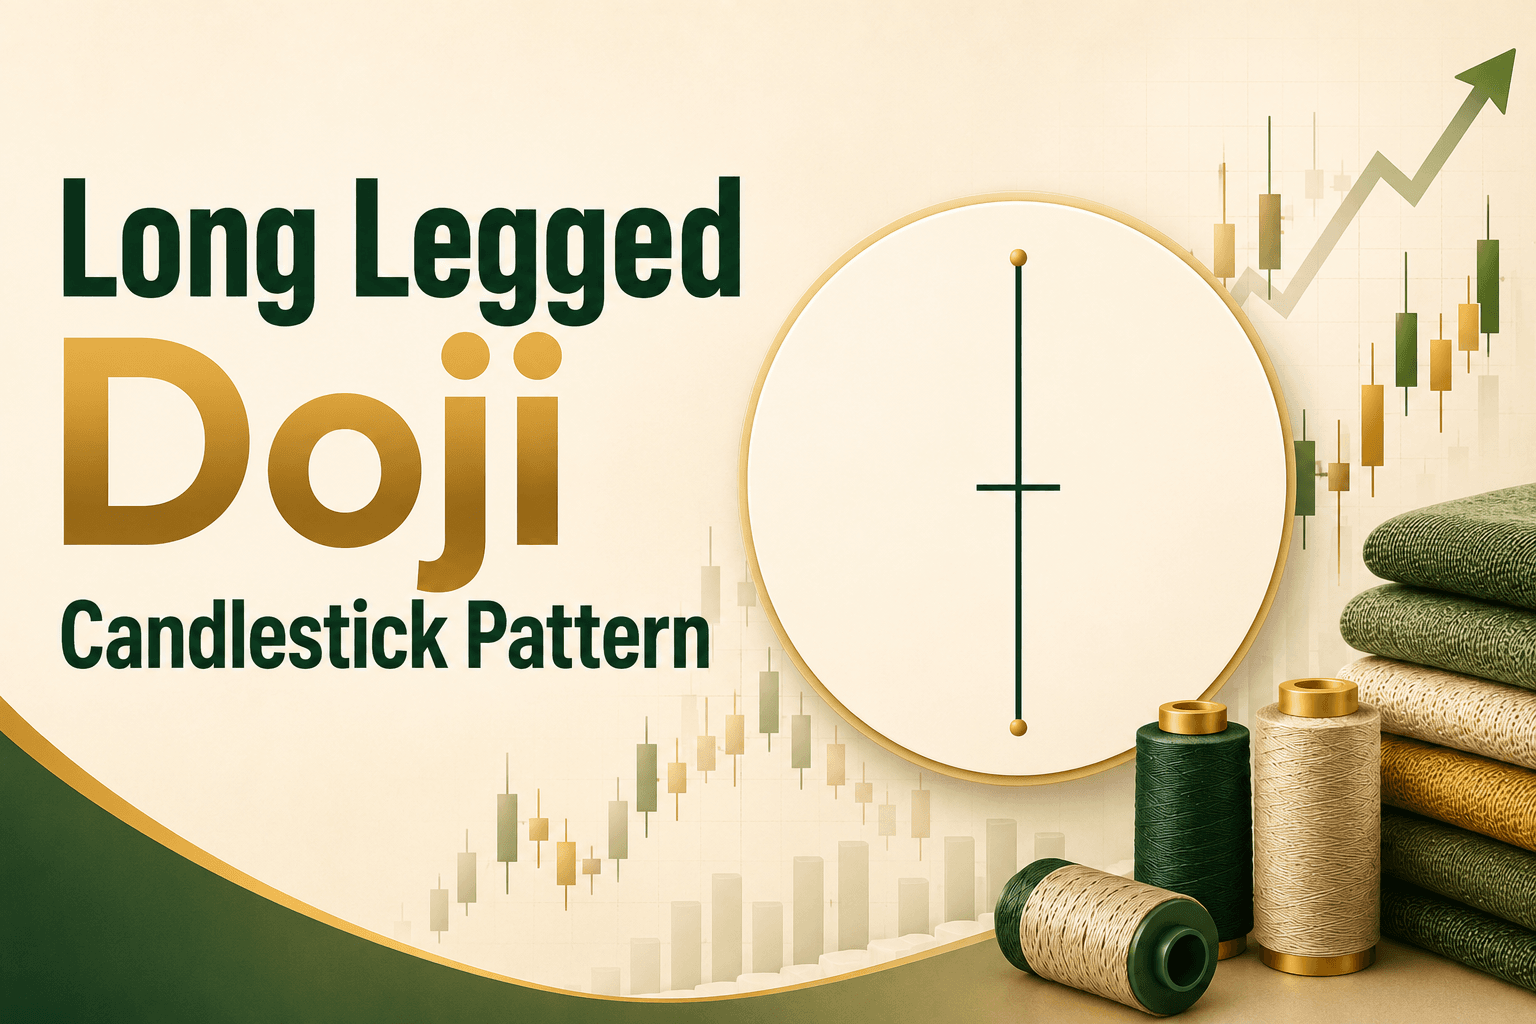
A long-legged doji is a candlestick pattern that forms when a security's opening and closing prices are nearly identical, but the session sees significant price movement in both directions before settling back near the open. This creates a candle with a very small or almost invisible body, flanked by long upper and lower wicks (shadows) on both sides.
The name comes from the visual appearance: the candle looks like it has two long "legs" extending above and below a tiny body, resembling a plus or cross shape on the chart.
Because the open and close are so close together, the long-legged doji candlestick reflects a session where buyers pushed prices up, and sellers pushed prices down (or vice versa) with roughly equal force, and neither side managed to hold control by the close.
The long-legged doji candle meaning centers on one concept: indecision. When this pattern appears, it suggests that neither buyers nor sellers were able to establish clear control during that trading session, despite significant price swings in both directions.
How to Identify a Long-Legged Doji Candlestick?
To recognize this pattern on a chart, look for these characteristics:
- Small real body: The open and close prices are very close, resulting in a thin or negligible body.
- Long upper shadow: The price moved well above the open/close level at some point during the session.
- Long lower shadow: The price also moved well below the open/close level during the same session.
- Roughly symmetrical wicks: In a textbook long-legged doji, the upper and lower shadows are of comparable length, though minor variation is normal.
This structure differs from a standard doji, which may have shorter or one-sided wicks, and from a dragonfly or gravestone doji, both of which have a pronounced wick on only one side.
Long Legged Doji Candlestick Pattern in Context
Context matters a great deal when interpreting this pattern. A few scenarios where it is commonly observed include:
- After an extended uptrend: A long-legged doji here may suggest that buying pressure is weakening and a reversal or consolidation phase could follow.
- After an extended downtrend: The pattern may indicate that selling pressure is losing steam, potentially setting the stage for a pause or reversal.
- During sideways or range-bound markets: The pattern may simply reflect ongoing indecision without any strong directional implication.
- Around major news events or earnings announcements: High volatility around such events can naturally produce long-legged doji candles, as prices swing sharply in response to new information before settling.
It is worth noting that no single candlestick pattern should be used in isolation to make investment or trading decisions. Most experienced market participants use this pattern as one input among several, often combined with support and resistance levels, trend lines, moving averages, or momentum indicators for confirmation.
Long Legged Doji vs Other Doji Types
Since "doji" refers to a family of candlestick patterns with a small body, it helps to distinguish the long-legged variant from its relatives:
- Standard Doji: Has a small body with shorter wicks on both sides, reflecting mild indecision.
- Dragonfly Doji: Has a long lower wick and little to no upper wick, often seen as a potential bullish signal after a downtrend.
- Gravestone Doji: Has a long upper wick and little to no lower wick, often seen as a potential bearish signal after an uptrend.
- Long Legged Doji: Has long wicks on both sides, reflecting stronger, more balanced volatility and deeper indecision than the standard doji.
Recognizing these distinctions helps avoid misreading a pattern and drawing an incorrect conclusion about market sentiment.
Limitations to Keep in Mind
While the long-legged doji is a widely recognized pattern in technical analysis, it comes with limitations that are important for any reader to understand:
- It does not predict direction on its own; it only signals indecision.
- Its reliability can vary across timeframes, asset classes, and market conditions.
- It should not be used as a standalone basis for buying or selling decisions.
- Past patterns do not guarantee future price behavior, and markets can behave unpredictably regardless of chart formations.
Technical analysis, including candlestick patterns, is one of several tools used to study price behavior. It works best when combined with a broader understanding of the company or asset, prevailing market conditions, and individual risk tolerance.
Conclusion
The long-legged doji is a distinctive candlestick pattern that captures a moment of genuine market indecision, where both buyers and sellers exert strong but ultimately balanced pressure within a single session. While it does not offer a directional forecast by itself, it can be a useful signal of weakening momentum or an upcoming shift when read in context with trend, volume, and other technical tools. Like all elements of technical analysis, it works best as part of a broader, well-researched approach to understanding the stock market.


