
If you've spent any time studying stock charts, you've probably noticed that price movements often form recognizable shapes. These shapes, known as candlestick patterns, help traders and investors understand market sentiment and potential price reversals. One such pattern that frequently comes up in technical analysis is the piercing line candlestick pattern.
This pattern is considered a bullish reversal signal, often appearing at the end of a downtrend. For anyone building their knowledge of share market investment, understanding candlestick patterns like this one can add another layer of insight when analyzing stock charts.
In this blog, we'll break down what the piercing line pattern is, how it forms, what it may indicate, and how investors typically use it alongside other tools.
What Is a Piercing Line Candlestick Pattern?
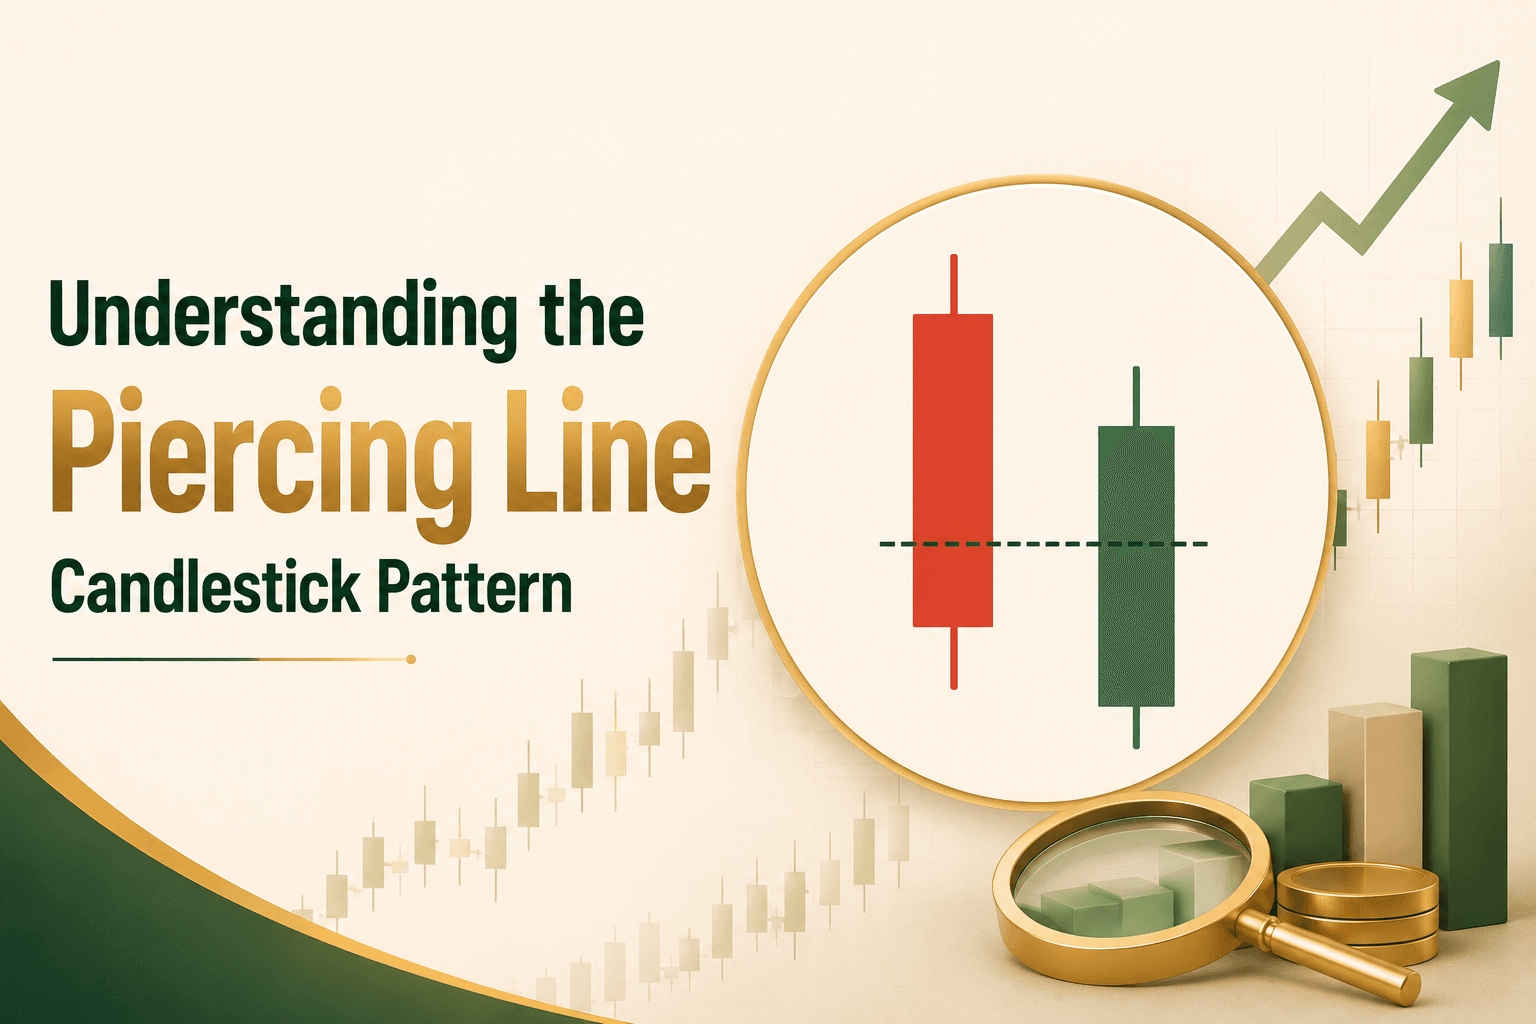
The piercing line candlestick pattern is a two-candle formation that typically appears during a downtrend and is viewed as a potential signal of a bullish reversal. It consists of:
- First candle: A long bearish (red or black) candle, reflecting continued selling pressure.
- Second candle: A bullish (green or white) candle that opens below the previous candle's low but closes above the midpoint of the first candle's real body.
The name "piercing" comes from the way the second candle "pierces" into the body of the first candle, closing more than halfway up into it. This suggests that buyers have stepped in with enough strength to reverse some of the losses from the prior session.
How Does the Pattern Form?
To understand the mechanics better, let's break down the sequence of events:
- The market is in a clear downtrend, with sellers dominating price action.
- On the first day, a long bearish candle forms, reinforcing the downward momentum.
- On the second day, the price gaps down at the open (often due to continued pessimism), but then buyers enter the market.
- Buying pressure pushes the price up throughout the session, and the candle closes above the midpoint of the previous day's bearish candle.
This shift, from a gap-down open to a strong recovery close, is what gives the pattern its significance. It shows a potential change in market psychology, from seller dominance to renewed buying interest.
Why Is the Piercing Line Pattern Important?
Candlestick patterns like the piercing line are used by traders as part of technical analysis to gauge potential shifts in market sentiment. Some reasons this pattern draws attention include:
- Signals a possible trend reversal: After a sustained downtrend, this pattern may indicate that selling pressure is weakening.
- Reflects a change in buyer-seller dynamics: The strong recovery in the second candle shows buyers regaining some control.
- Useful with other indicators: When combined with volume analysis, support levels, or momentum indicators, the pattern can offer a more rounded view of potential price action.
That said, no single candlestick pattern should be relied upon in isolation. Markets are influenced by numerous factors, and patterns work best as part of a broader analytical approach.
Piercing Line vs. Bullish Engulfing Pattern
Many investors confuse the piercing line pattern with the bullish engulfing pattern, as both appear during downtrends and signal potential reversals. Here's the key difference:
Feature | Piercing Line | Bullish Engulfing |
Second candle's close | Closes above the midpoint of the first candle | Closes above the entire first candle's open |
Strength of signal | Moderate | Generally considered stronger |
Candle Overlap | Partial | Full |
Understanding this distinction can help avoid misreading chart patterns, especially for those newer to technical analysis.
Limitations of the Piercing Line Pattern
While this pattern can offer useful insight, it's important to approach it with a balanced perspective:
- False signals can occur: Not every piercing line pattern leads to a sustained reversal. Prices may resume their downtrend afterward.
- Context matters: The pattern is more meaningful when it appears near established support levels or after a prolonged downtrend, rather than in isolation.
- Confirmation is often needed: Many analysts wait for the next candle or additional indicators to confirm the reversal before drawing conclusions.
This is why relying solely on candlestick patterns without broader analysis can be risky, particularly for those new to share market investment.
How Investors Can Use This Pattern?
For those learning about stock market investment, candlestick patterns are typically one part of a larger toolkit rather than standalone decision-making signals. Some general practices include:
- Studying the pattern in conjunction with trend lines, support and resistance zones, and volume data
- Avoiding decisions based on a single candlestick pattern alone
- Practicing pattern recognition using historical charts before applying it to live analysis
- Staying updated with company fundamentals and broader market conditions, since technical patterns don't account for news-based volatility
Many investors today track such patterns conveniently through a share market app, which often provides live charting tools, technical indicators, and historical data to help with pattern recognition.
Final Thoughts
The piercing line candlestick pattern is a widely recognized formation in technical analysis, offering a glimpse into potential shifts in market sentiment after a downtrend. However, like all chart patterns, it works best when used alongside other analytical tools and a sound understanding of market context, not as a standalone signal for making investment decisions.
As with any aspect of investment in the share market, continuous learning, patience, and a disciplined approach tend to serve investors better than relying on any single indicator. Whether you're just starting to explore stock market investment or refining your technical analysis skills, understanding patterns like the piercing line adds one more useful layer to your overall market knowledge.


