
If you have spent any time studying price charts, you have probably come across candlesticks with small bodies and long upper wicks sitting at the bottom of a downtrend. This is one of the more talked-about reversal signals in technical analysis: the inverted hammer. It shows up often in share market investment discussions, yet many beginners confuse it with its cousin, the shooting star, or misread what it is actually signaling.
This guide breaks down the inverted hammer candlestick - what it looks like, what it means, how it differs from similar patterns, and how it is typically used alongside other tools. Whether you are new to the stock market or brushing up on candlestick basics, this should give you a clear, practical understanding.
What Is an Inverted Hammer Candlestick?
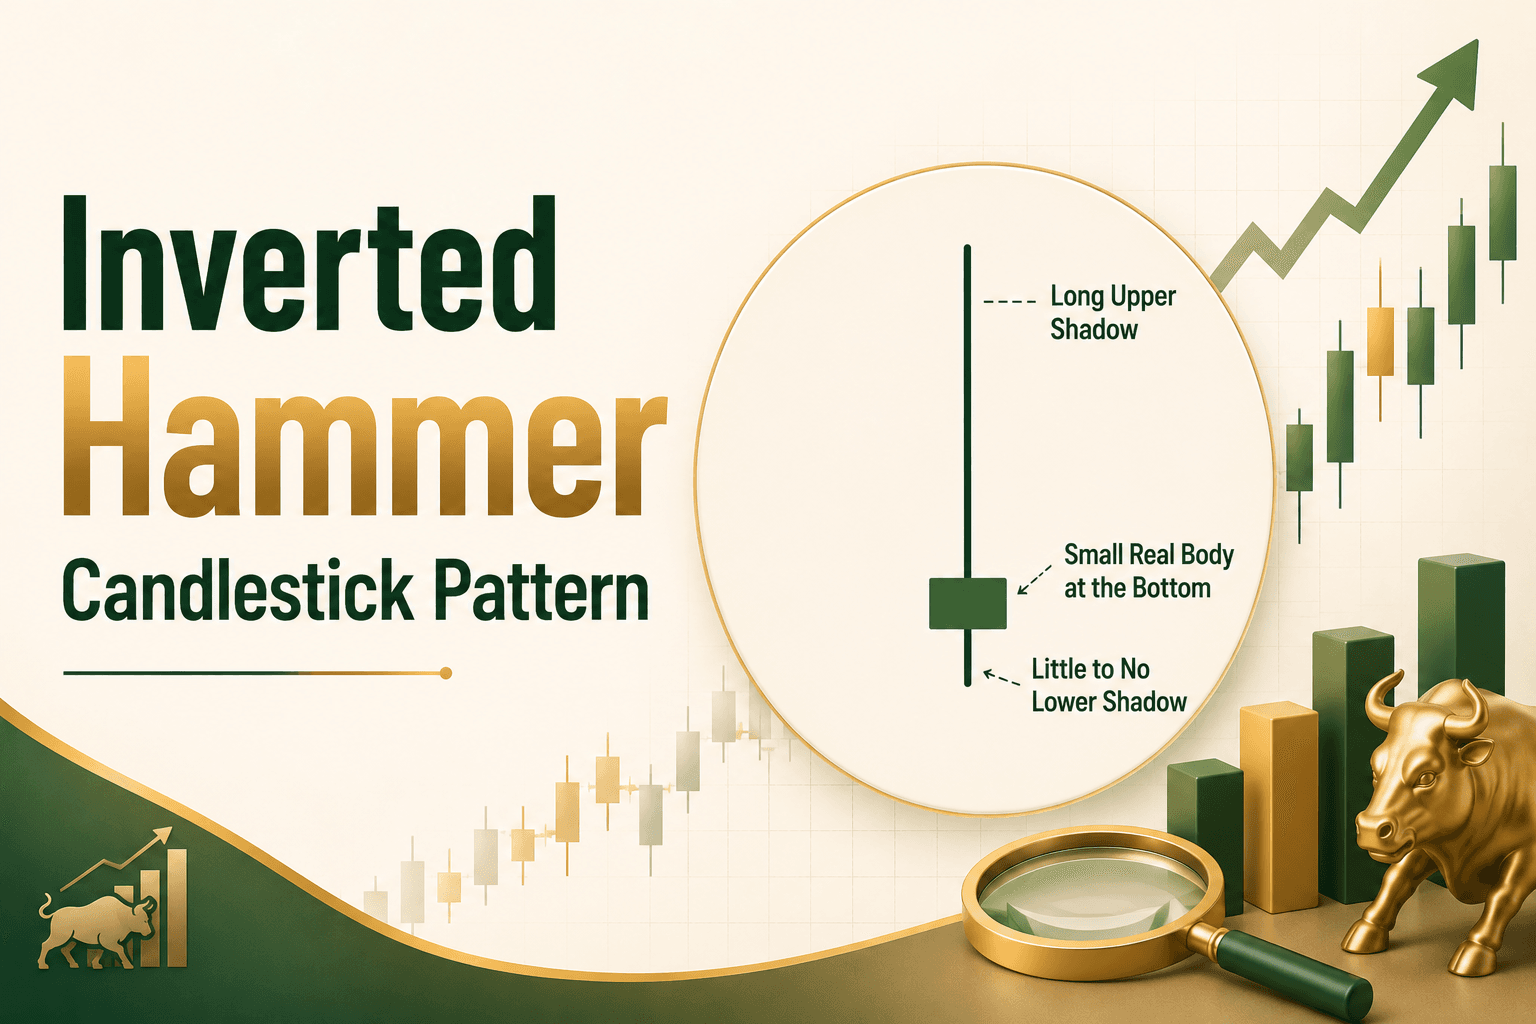
An inverted hammer is a single-candle pattern that typically appears after a decline in price. It has three defining features:
- A small real body located near the lower end of the candle's range
- A long upper wick, usually at least twice the length of the body
- Little to no lower wick
Visually, it looks like an upside-down version of the standard hammer pattern, hence the name. The long upper shadow shows that buyers pushed the price significantly higher during the session, even though sellers managed to pull it back down before the close. The body itself can be either bullish (close above open) or bearish (close below open); the color is secondary to the shape and location within the trend.
Inverted Hammer Meaning: What Is It Telling Traders?
The inverted hammer pattern forms after a downtrend and is generally read as an early signal of a potential bullish reversal. The logic behind this interpretation is straightforward:
- The session opens near the low of the recent trend.
- Buyers step in and drive the price up substantially during the day.
- Sellers regain some control before the close, pushing the price back down, but they are not able to erase all the gains.
This tug-of-war suggests that selling pressure may be weakening and that buying interest is starting to build, even though the sellers still had the final say in that particular session. Because of this, the inverted hammer is considered a pattern that requires confirmation; it hints at a possible shift in momentum rather than confirming one outright.
Bullish Inverted Hammer vs Bearish Inverted Hammer
A common point of confusion is whether the candle's color changes its meaning. Here is how the two variations are generally understood:
- Bullish inverted hammer: The candle closes above its opening price (often shown as a green or white candle). Since the close is higher than the open, this version is usually seen as carrying a slightly stronger bullish undertone, though it still needs confirmation from the next candle.
- Bearish inverted hammer: The candle closes below its opening price, typically shown as a red inverted hammer candlestick. Even though the body is red, the pattern's location at the bottom of a downtrend and its long upper wick can still be read as an early reversal signal; the color reflects the intraday battle, not necessarily the overall interpretation.
In both cases, what matters most to technical analysts is the pattern's position within the broader trend and what happens on the candles that follow it, rather than the color of the body alone.
Inverted Hammer vs Shooting Star: Don't Get Confused
These two patterns look almost identical, which is why they are frequently mixed up:
Feature | Inverted Hammer | Shooting Star |
Prior trend | Appears after a downtrend | Appears after an uptrend |
General signal | Potential bullish reversal | Potential bearish reversal |
Shape | Small body, long upper wick, little lower wick | Small body, long upper wick, little lower wick |
The shape of the candle is the same; what differs is the context in which it appears. This is a good reminder that no candlestick pattern should be read in isolation; the preceding trend is part of the signal itself.
How Traders Typically Use the Inverted Hammer Pattern?
Because a single candle rarely tells the whole story, the inverted hammer candlestick pattern is usually combined with additional confirmation before it is acted upon. Some commonly referenced approaches include:
- Waiting for the next candle: A strong bullish candle following the inverted hammer, closing above its high, is often treated as confirmation of the potential reversal.
- Checking volume: Higher-than-average trading volume on the inverted hammer or the confirming candle is sometimes viewed as adding weight to the signal.
- Using support levels: An inverted hammer forming near a known support zone or a prior demand area is generally considered more meaningful than one appearing in the middle of a trend with no context.
- Combining with indicators: Tools such as the Relative Strength Index (RSI) or moving averages are often used alongside candlestick patterns to cross-check whether momentum genuinely supports a reversal.
None of these methods guarantee an outcome; they are simply ways analysts try to filter out false signals, which are common with single-candle patterns.
Limitations of the Inverted Hammer Pattern
It is worth being upfront about the pattern's limitations:
- It is a single-candle formation, which makes it less reliable on its own compared to multi-candle patterns.
- It can appear frequently on charts, and not every occurrence leads to an actual reversal.
- Its reliability can vary depending on the timeframe, the instrument being traded, and overall market conditions.
- Like all technical patterns, it reflects historical price behavior and does not predict future price movement with certainty.
Recognizing these limitations is part of using any charting tool responsibly.
Conclusion
The inverted hammer candlestick pattern is a useful visual cue that shows a possible tug-of-war between buyers and sellers after a downtrend. Whether you encounter a bullish inverted hammer, a bearish inverted hammer, or a red inverted hammer candlestick, the underlying idea stays the same: it is an early signal, not a confirmed reversal. Pairing it with volume analysis, support and resistance levels, and confirmation from subsequent price action gives it more context and can help reduce the chances of acting on a false signal.


