
If you spend enough time reading stock charts, you start to notice that price movements are rarely random. They leave behind patterns, some obvious, some subtle, that experienced traders have studied and named over centuries. One such pattern is the Rising Three Methods, a candlestick formation that signals a likely continuation of an uptrend. For anyone serious about share market investment, understanding this pattern can add a meaningful layer of confidence to trading decisions.
This blog breaks down everything you need to know about the Rising Three Methods, what it looks like, what it means, how to identify it, and how to use it practically.
What Is the Rising Three Methods Candlestick Pattern?
The Rising Three Methods is a bullish continuation pattern in technical analysis. It tells traders that despite a brief pause or minor pullback, the prevailing upward trend is likely to continue.
It belongs to a category of candlestick patterns that originated in Japanese rice trading in the 18th century, later popularized in the West by technical analyst Steve Nison. Unlike reversal patterns that signal a change in direction, the Rising Three Methods is specifically a continuation signal; it suggests the bulls are simply taking a breather before pushing prices higher again.
What Does the Pattern Look Like?
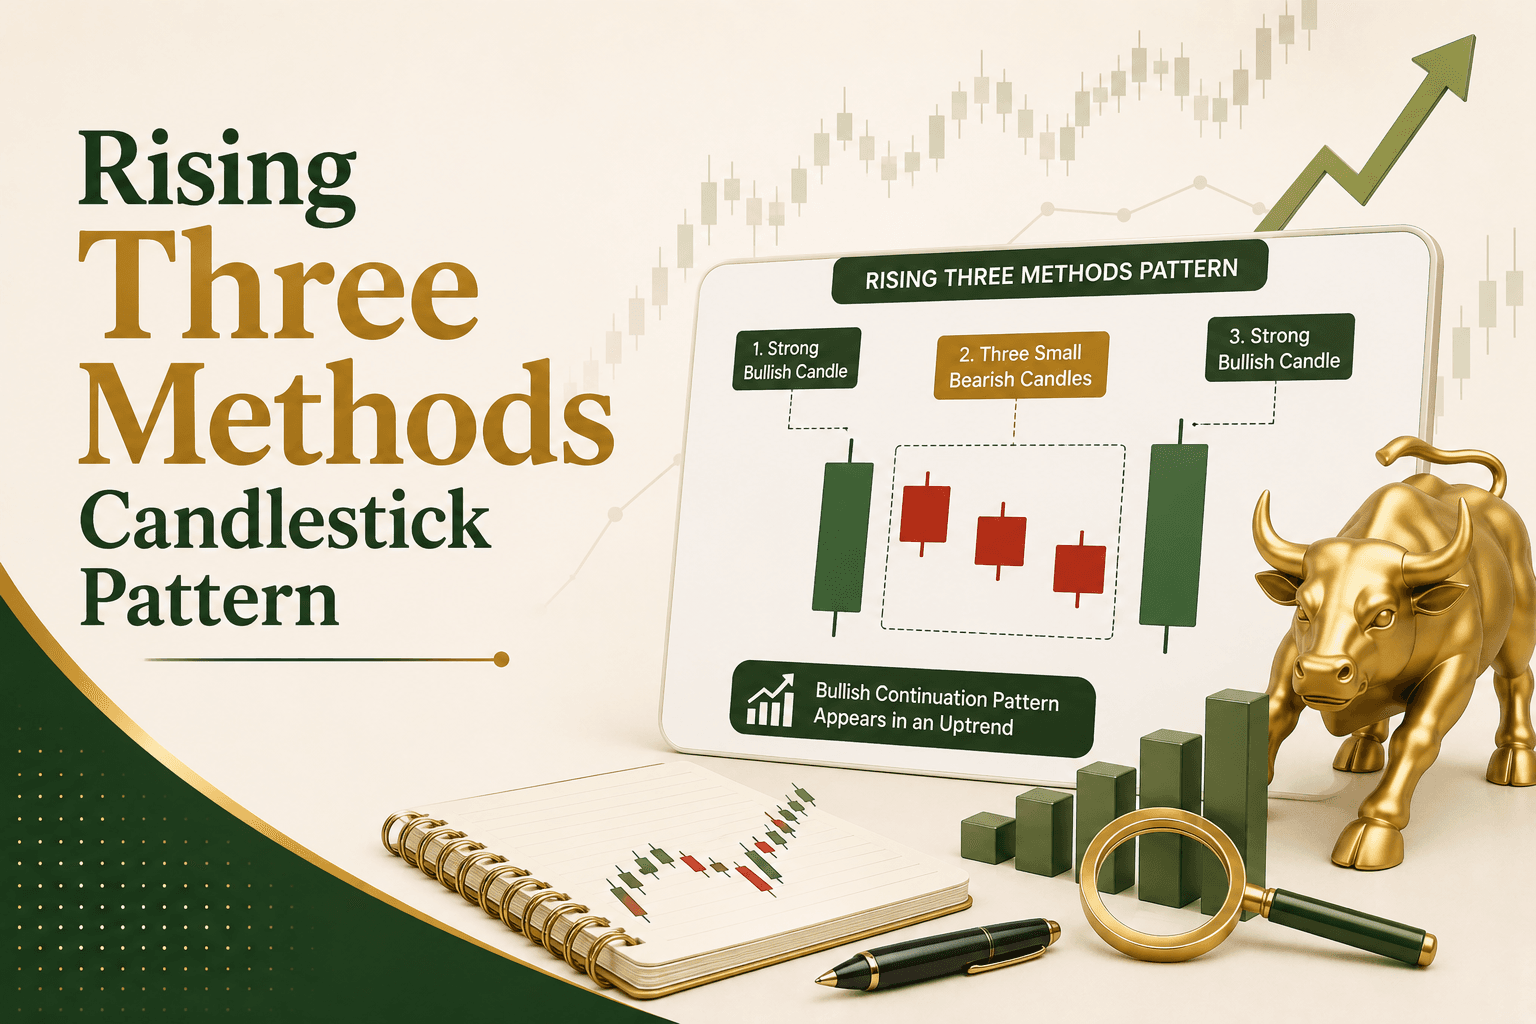
The Rising Three Methods pattern is made up of five candlesticks. Here's how they appear on a chart:
1. A Long Bullish Candle:
The pattern opens with a strong green (bullish) candle, confirming that buyers are firmly in control. This candle has a notably large body.
2. Three Small Bearish Candles:
This is followed by three small red (bearish) candles. Each of these candles trades within the range of the first large candle; they don't push below its low. This is important. The pullback looks real, but it's contained. Volume during these three candles is typically lower than the first candle, suggesting that sellers are not particularly aggressive.
Note: While three middle candles are the textbook standard, the pattern is still valid if there are two or four small consolidation candles, as long as they stay within the first candle's range.
3. A Long Bullish Candle:
The fifth and final candle is another large green candle. It opens above the close of the previous small candles and closes above the high of the first bullish candle. This is the confirmation that the uptrend has resumed.
Think of it this way: the first candle represents momentum, the three middle candles represent consolidation, and the final candle represents resumption.
The Psychology Behind the Pattern
Charts reflect human behavior, and candlestick patterns are essentially a visual record of market sentiment at any given time.
In the Rising Three Methods, the initial large bullish candle shows strong buying interest. Then, for a few sessions, profit-taking or mild selling pressure causes a dip, but crucially, this dip doesn't break the trend. Buyers are not running away; they are waiting. The three small candles represent indecision and consolidation, not a reversal in sentiment.
When the fifth candle, another strong bullish one, appears, it signals that the buyers have returned with force. The brief pause has ended, and the upward momentum is back. This is why the pattern is a continuation signal and not a reversal one.
How to Identify the Rising Three Methods: A Checklist
Before acting on what you think is this pattern, verify these conditions:
- The chart is in a clear uptrend before the pattern forms
- The first candle is a long bullish candle
- The next three candles are small and bearish, staying within the high-to-low range of the first candle (though ideally remaining within its real body)
- The three middle candles show lower trading volume
- The fifth candle is a long bullish candle that closes above the high of the first candle
- The fifth candle ideally comes with a surge in volume, confirming buyer commitment
If all these conditions are met, the Rising Three Methods pattern is considered valid.
Rising Three Methods vs. Falling Three Methods
It helps to understand that this pattern has a bearish counterpart, the Falling Three Methods. While the Rising Three Methods appears in an uptrend and signals continuation of buying momentum, the Falling Three Methods appears in a downtrend and confirms that selling pressure will likely continue.
In the Falling Three Methods, the setup is mirrored: a large red candle, followed by three small bullish candles that remain within the first candle's range, followed by another large red candle that closes below the low of the first.
Knowing both versions helps traders identify continuation signals in both market directions.
How to Use This Pattern in Practice?
Recognizing a candlestick pattern is only part of the process. Using it effectively requires some discipline. Here's a practical approach:
1. Wait for Confirmation:
Do not act on the pattern until the fifth candle has fully closed. A partial fifth candle that looks bullish can still reverse. Confirmation comes only at the close.
2. Check the Volume:
A rising fifth candle accompanied by strong volume adds significant credibility to the pattern. If volume is low on the final candle, treat the signal with more caution.
3. Combine With Other Indicators:
The Rising Three Methods works best when it appears alongside supporting signals such as:
- Moving averages: Is the price above key moving averages like the 50-day or 200-day MA?
- RSI (Relative Strength Index): Is momentum broadly in the bullish zone?
- Support levels: Did the three small candles pull back to a known support area?
Using the pattern in isolation without any supporting context increases the risk of false signals.
4. Set a Stop-Loss:
In share market investment, risk management is non-negotiable. When trading based on this pattern, a common approach is to place a stop-loss just below the low of the three small middle candles. If the price breaks below that zone, the pattern has likely failed.
Limitations of the Rising Three Methods
No candlestick pattern, including this one, works all the time. Here are some honest limitations to keep in mind:
- It's a lagging indicator: Like most technical patterns, the Rising Three Methods confirms what has already happened in price action. By the time you act, some of the move may already be priced in.
- It can produce false signals: In volatile markets or during major news events, prices can behave unpredictably, and even well-formed patterns can fail.
- It requires context: The pattern has little value in a sideways or ranging market. It is specifically designed for trending conditions.
- Subjectivity plays a role: Two traders looking at the same chart can sometimes interpret whether the middle candles are truly "within range" differently.
These limitations are not reasons to dismiss the pattern; they are reasons to use it thoughtfully, as one input among several.
The Rising Three Methods in Today's Stock Market
With stock market participation growing significantly over the last several years, driven by easier access through share market apps and online brokerages, more retail investors are encountering technical analysis tools like candlestick patterns for the first time.
Most modern share market apps and charting platforms today can display candlestick charts with ease, and many even have pattern recognition tools built in. However, understanding why a pattern forms and the underlying psychology is what separates informed trading from button-pressing.
The Rising Three Methods is particularly useful for swing traders and positional traders who hold positions over several days or weeks. It helps them stay in a trade during minor pullbacks instead of exiting prematurely.
A Quick Example (Conceptual)
Imagine a stock that has been trending upward steadily over three weeks. On Monday, it forms a strong green candle, closing significantly higher than it opened. Over the next three sessions (Tuesday to Thursday), the price edges slightly lower, forming three small red candles — but none of them close below Monday's opening. Volume during these three days is notably lower.
On Friday, the stock opens above Thursday's close and rallies strongly, closing above Monday's high. Volume spikes back up.
This is a textbook Rising Three Methods. A trader watching this chart would see it as confirmation that the uptrend is intact and that the pullback was likely just profit-taking or consolidation, not a reversal.
Final Thoughts
The Rising Three Methods candlestick pattern is one of the more reliable continuation signals in technical analysis, particularly when confirmed by volume and broader market context. It captures a recognizable cycle in market behavior: strong momentum, a pause, and then a resumption, something that plays out repeatedly across different stocks, indices, and timeframes.
For those engaged in share market investment, adding this pattern to your analytical toolkit can help you avoid exiting trades too early during healthy consolidations and give you more conviction to stay in a rising trend.
That said, no pattern or tool should be the sole basis for a trading decision. Sound risk management, a clear strategy, and patience remain the foundations of consistent performance in the stock market.


