
If you have ever opened an equity research report and felt buried under jargon like "EBITDA margin," "target price," or "overweight rating," you are not alone. Most first-time investors skim past the headline recommendation, buy, hold, or sell, without understanding the reasoning behind it. That's a missed opportunity, because a research report is essentially a roadmap of how an analyst thinks about a company's business, its risks, and its future earnings potential.
Learning how to read equity research reports properly can change the way you approach investment in share market. Instead of blindly following a tip or a headline, you start evaluating ideas the way professional analysts do, by looking at numbers, assumptions, and context together.
This guide breaks down the structure of a typical equity research report, explains the key terms you'll encounter, and shows you how to use this information sensibly as part of your own share market investment process.
What Is an Equity Research Report?
An equity research report is a document prepared by financial analysts, typically working for brokerages, asset management companies, or independent research firms, that evaluates a publicly listed company. The goal is to help investors understand whether a stock is attractively priced relative to its business fundamentals and future prospects.
In India, equity research reports are published by SEBI-registered research analysts and brokerage houses such as full-service brokers and discount broking platforms. Many share market apps now make these reports accessible directly within the app, alongside live prices and charts, so retail investors can read analyst views without needing a separate subscription.
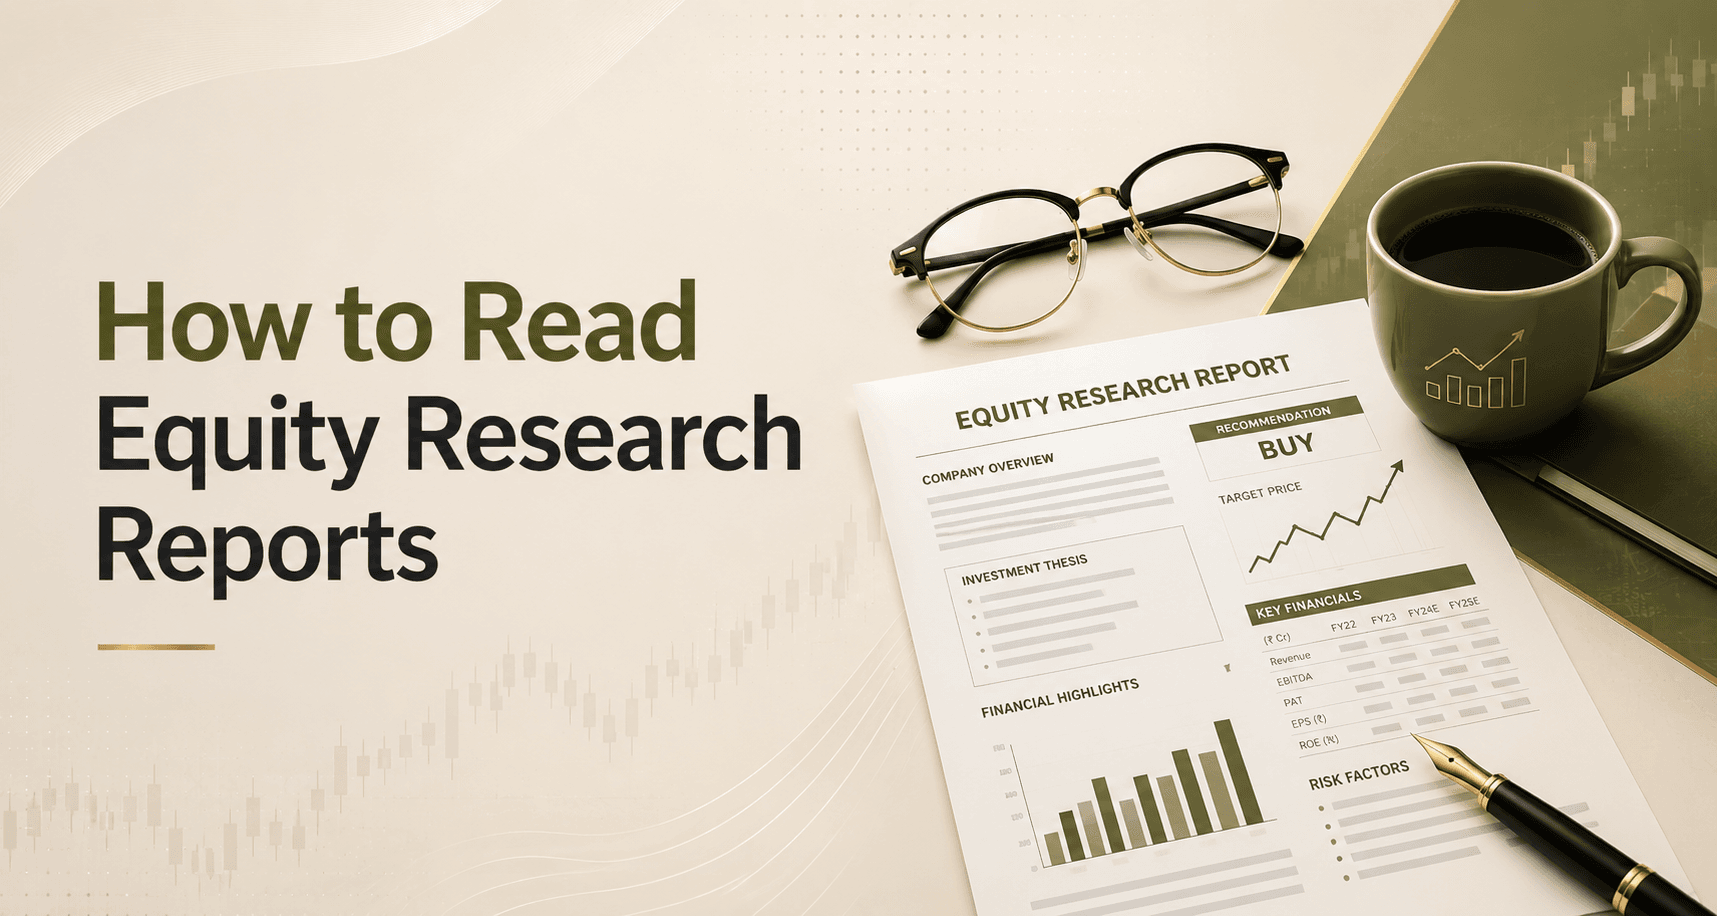
A typical equity research report includes:
- A summary recommendation (Buy, Hold, Sell, or similar)
- A target price and time horizon
- An overview of the company's business and industry
- Financial analysis and key ratios
- Risks and triggers that could affect the stock
- Valuation methodology
Understanding each of these sections is the first step toward making informed decisions rather than reactive ones.
Why Reading Equity Research Reports Matters?
Many retail investors enter the stock market based on tips from friends, social media, or news headlines. While these sources aren't inherently wrong, they rarely explain the underlying logic. Equity research reports, on the other hand, are built on financial modeling, management interactions, and industry analysis.
Reading these reports helps you:
- Understand the "why" behind a stock recommendation instead of just the "what."
- Compare analyst views across brokerages to see where opinions converge or diverge.
- Build your own filter for separating well-reasoned analysis from noise.
- Track a company's progress by comparing report updates over time, quarterly results, management commentary, and changing estimates.
This is particularly useful for anyone serious about long-term investment in share market, since it shifts the focus from short-term price movements to business fundamentals.
Breaking Down the Structure of an Equity Research Report
1. The Recommendation and Target Price:
This is usually the first thing you see: a rating such as "Buy," "Accumulate," "Hold," "Reduce," or "Sell," along with a target price and the time frame for that target (commonly 12 months).
What to check:
- Is the target price based on a reasonable valuation method? (Covered in the next section.)
- How far is the target price from the current market price? This indicates the analyst's expected upside or downside.
- What is the time horizon? A 12-month target behaves very differently from a 3-year thesis.
It helps to remember that a rating is an opinion based on assumptions at a point in time. Company performance, broader market conditions, and macroeconomic factors can change those assumptions quickly.
2. Company and Industry Overview:
This section explains what the company does, its market position, competitive landscape, and the broader industry trends affecting it. For instance, a report on an IT services company might discuss global technology spending trends, currency movements, and client concentration.
This section is valuable because it gives context. A strong company in a weak industry can still struggle, and a mediocre company in a booming sector can outperform temporarily. Understanding industry dynamics helps you judge whether the analyst's optimism (or caution) is grounded in something structural or merely cyclical.
3. Financial Analysis and Key Metrics:
This is usually the most data-heavy part of the report, and it's where many readers either get lost or skip ahead. A few terms worth understanding:
- Revenue growth: Year-on-year and quarter-on-quarter growth in sales.
- EBITDA margin: Earnings before interest, tax, depreciation, and amortization, expressed as a percentage of revenue, a measure of operating efficiency.
- Net profit margin: How much of revenue converts into actual profit after all expenses.
- EPS (Earnings Per Share): Net profit divided by the number of outstanding shares, used to gauge profitability per share.
- P/E ratio (Price to Earnings): Current share price divided by EPS, commonly used to assess whether a stock is expensive or cheap relative to earnings.
- ROE (Return on Equity) and ROCE (Return on Capital Employed): Indicators of how efficiently a company uses shareholder money and total capital to generate profits.
- Debt-to-equity ratio: A measure of financial leverage and balance sheet risk.
You don't need to memorize formulas. What matters is recognizing whether these numbers are improving, stable, or deteriorating over time, and how the company compares to peers in the same sector.
4. Valuation Methodology:
Analysts typically arrive at a target price using one or more valuation methods:
- P/E multiple method: Applying a price-to-earnings multiple (based on historical averages or peer comparisons) to projected earnings.
- Discounted Cash Flow (DCF): Estimating the present value of a company's future free cash flows.
- EV/EBITDA: Comparing enterprise value to operating earnings, often used for capital-intensive businesses.
- Sum-of-the-parts (SOTP): Valuing each business segment separately and adding them up is common for diversified conglomerates.
It's worth asking: does the valuation method suit the type of business? A DCF model is more meaningful for a stable, cash-generating business than for an early-stage company with volatile earnings.
5. Risks and Triggers:
A credible report will outline potential risks to the thesis, including regulatory changes, raw material price volatility, competitive pressures, currency fluctuations, and management changes. Pay close attention to this section. It often gets glossed over, but it reflects the analyst's honesty and the report's overall reliability.
Also look for "triggers", upcoming events like quarterly results, product launches, or regulatory decisions that could materially affect the stock price. These help you understand what to track going forward.
6. Analyst and Brokerage Disclosures:
SEBI-registered research analysts are required to disclose any potential conflicts of interest, such as whether the brokerage holds a position in the stock or has a business relationship with the company. This section is usually at the end of the report, but it's important for assessing the credibility of the analysis. A reputable report will always include this disclosure clearly.
How to Use Equity Research Reports Sensibly?
Once you understand the structure, the next step is to use this information wisely:
- Read multiple reports, not just one. Different brokerages may have different assumptions and conclusions. Comparing a few gives you a more balanced view.
- Focus on the reasoning, not just the rating. A "Buy" rating with weak supporting logic should raise more questions than a "Hold" rating with strong analysis.
- Track report updates over time. Quarterly result updates show whether the company is meeting, beating, or missing analyst expectations.
- Cross-check with company filings. Annual reports, investor presentations, and stock exchange disclosures are publicly available and let you verify the figures analysts use.
- Understand your own risk appetite and time horizon. A report's 12-month target may not align with your personal investment goals.
Many share market apps today integrate broker research directly into their platforms, making it easier to access multiple reports, track price targets, and follow earnings updates in one place. Using these tools alongside your own reading habits can make the research process more efficient.
A Word on Compliance and Investor Responsibility
It's worth repeating: equity research reports are opinions formed using available data and reasonable assumptions, not guarantees of future performance. Stock markets are inherently subject to risks, and past performance or analyst targets do not assure future returns. SEBI mandates that all research analysts and brokerages include risk disclosures, and as an investor, it is equally important to read these disclosures rather than skip them.
Before acting on any report, consider your own financial goals, risk tolerance, and time horizon. If needed, consult a SEBI-registered investment adviser who can evaluate your specific financial situation.
Conclusion
Reading equity research reports is a skill that improves with practice. The more reports you read, the more patterns you start noticing in how analysts build their thesis, where their assumptions hold up, and where they tend to fall short. Over time, this habit can make you a more informed and confident participant in the stock market, rather than someone reacting to headlines or hearsay.
Whether you're just starting your investment in share market or have been investing for years, treating equity research reports as a tool for understanding, not a shortcut for decision-making, is what separates informed investors from impulsive ones.


