
Every seasoned investor will tell you the same thing: price charts can tell you what a stock is doing, but only fundamental analysis tells you why it might be worth owning in the first place. If you're serious about share market investment, understanding the company behind the ticker symbol matters just as much as timing your entry or exit.
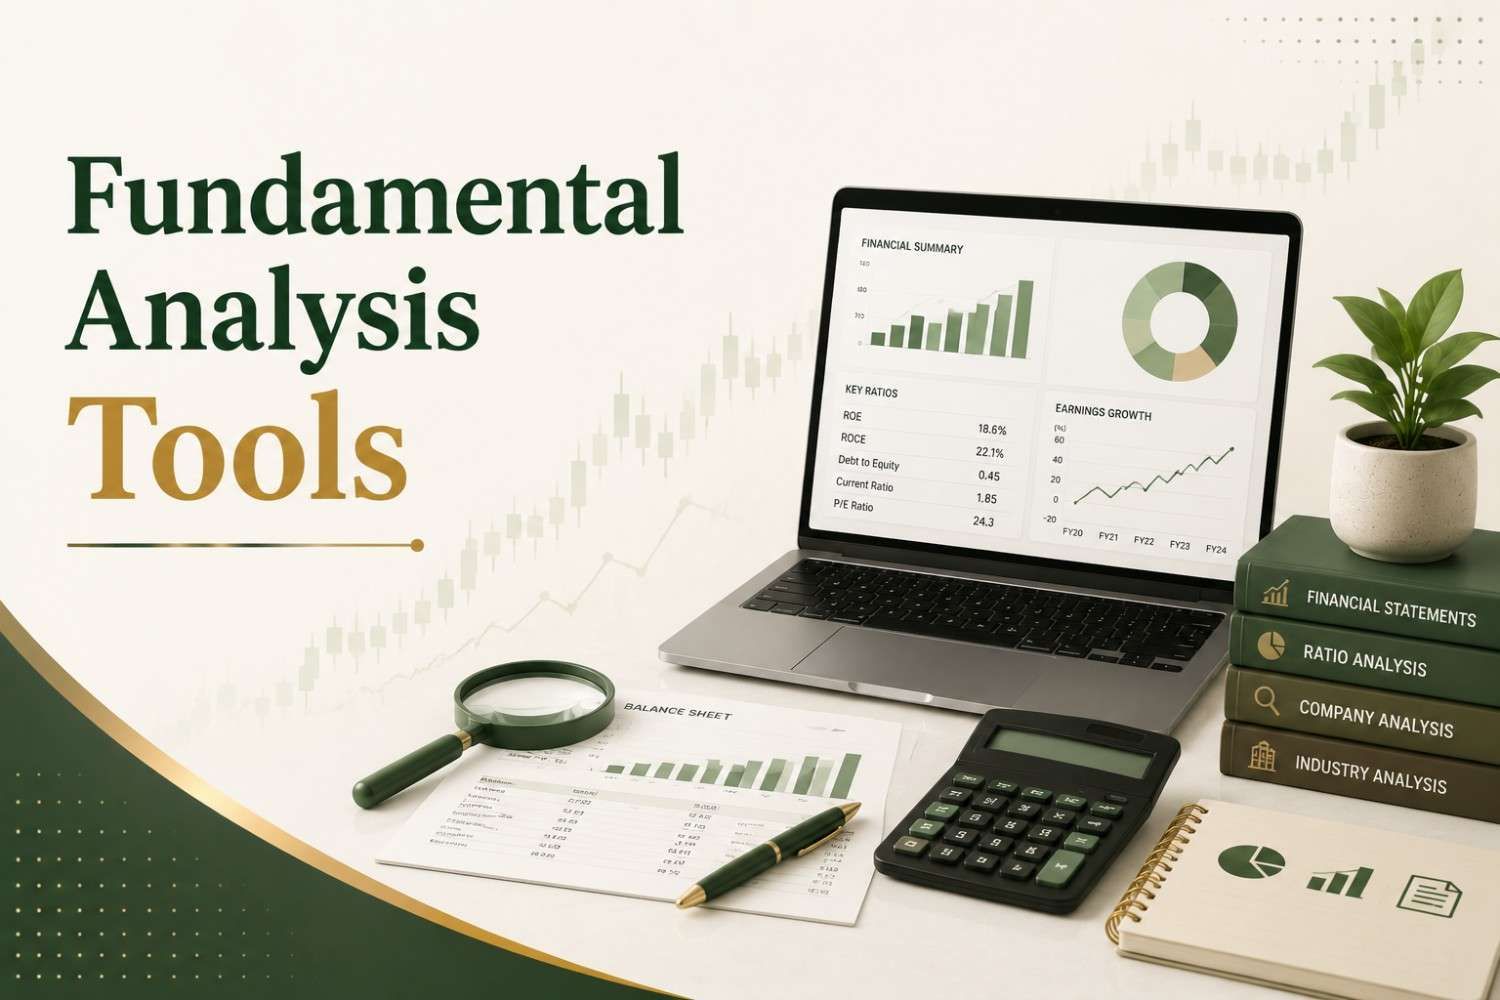
Fundamental analysis tools help you do exactly that; they break down a company's financial health, profitability, and growth potential into numbers and ratios you can actually compare across companies and sectors. With the rise of digital platforms, a fundamental analysis online tool can now do in seconds what used to take analysts hours of manual calculation.
This guide walks through the most widely used fundamental analysis tools, how they work, and how to use them sensibly as part of your stock market research.
What Is Fundamental Analysis, Exactly?
Fundamental analysis is the process of evaluating a company's intrinsic value by examining its financial statements, business model, management quality, competitive position, and the broader economic environment it operates in. The underlying idea is simple: a stock's price should, over time, reflect the real value of the business behind it. When there's a gap between price and value, that's where opportunity (or risk) often lies.
Fundamental analysis is generally split into two layers:
- Quantitative analysis - financial ratios, earnings, revenue growth, debt levels, and other measurable data points.
- Qualitative analysis - management track record, brand strength, industry positioning, and regulatory environment.
Most fundamental analysis tools focus heavily on the quantitative side simply because that data is structured, available in public filings, and easy to compare across companies.
Core Fundamental Analysis Tools and Metrics
Before jumping into apps and platforms, it helps to understand the actual metrics these tools calculate and display. Here are the ones you'll encounter most often.
1. Price-to-Earnings (P/E) Ratio:
This compares a company's share price to its earnings per share. A high P/E can suggest the market expects strong future growth, while a low P/E might indicate undervaluation or underlying problems. P/E is most useful when compared within the same industry, since "normal" ratios vary widely between sectors like IT and banking.
2. Price-to-Book (P/B) Ratio:
This measures the share price relative to the company's book value (assets minus liabilities). It’s particularly relevant for financial institutions like banks, as well as other capital-heavy businesses.
3. Earnings Per Share (EPS):
EPS shows how much profit is attributable to each outstanding share. Consistent EPS growth over multiple years is often a healthier signal than a single strong quarter.
4. Return on Equity (ROE):
ROE measures how efficiently a company generates profit from shareholders' equity. It's a useful indicator of management efficiency, though it should be read alongside debt levels, since high leverage can artificially inflate ROE.
5. Debt-to-Equity Ratio:
This shows how much of the company's financing comes from debt versus shareholder funds. A very high ratio can signal financial risk, especially in rising interest rate environments.
6. Dividend Yield:
For income-focused investors, dividend yield (annual dividend divided by share price) indicates how much cash return a stock offers relative to its price.
7. Free Cash Flow (FCF):
FCF reflects the actual cash a business generates after capital expenditure. Many analysts consider it more reliable than net profit, since profit figures can be influenced by accounting adjustments.
Fundamental Analysis Online Tools: What They Actually Do
A fundamental analysis online tool essentially automates the data-gathering and calculation process described above. Instead of manually pulling numbers from annual reports and quarterly filings, these platforms aggregate financial statements, compute ratios, and often present historical trends through charts and screeners.
Typical features you'll find in a good fundamental analysis online tool include:
- Financial statement breakdowns (balance sheet, income statement, cash flow statement) are presented in a readable format.
- Ratio analysis is calculated automatically and updated with each earnings release.
- Peer comparison to benchmark a company against industry competitors.
- Historical trend charts for revenue, profit, and key ratios over multiple years.
- Stock screeners that let you filter companies by ratio thresholds (for example, P/E below a certain number or ROE above a certain percentage).
- Corporate announcements and filings tracking, including board decisions, dividend declarations, and credit rating updates.
These tools don't replace your own judgment, but they significantly reduce the time needed to shortlist companies worth deeper research.
Choosing a Trading App for Fundamental Data
Most major share market apps in India and globally now bundle fundamental data alongside their trading functionality. When evaluating a trading app for this purpose, a few practical things are worth checking:
- Data source and update frequency: Is the data sourced from official exchange filings, and how quickly is it refreshed after results are announced?
- Depth of historical data: Some apps show only the last 2–3 years; serious analysis often benefits from 5–10 years of data to spot cyclical patterns.
- Regulatory standing: Stick to apps and platforms operated by SEBI-registered brokers or recognized financial data providers, since this affects both data reliability and the safety of your funds if the app also offers trading.
- Clarity of presentation: A good app should explain what each ratio means, not just display a number without context.
It's worth noting that no single app or tool guarantees accuracy or predictive power. Cross-checking key figures against the company's official annual report or exchange filings (available on NSE/BSE websites) is good practice before making any investment decision.
How to Use These Tools in Your Research Process?
A reasonable approach to using fundamental analysis tools looks something like this:
- Start with a screener to shortlist companies that meet your basic criteria (sector, market cap, profitability trends).
- Review the financial statements for at least 3–5 years to understand consistency, not just a single good or bad year.
- Compare ratios against industry peers, not in isolation, since "good" or "bad" numbers are relative to the sector.
- Read management commentary in annual reports or earnings calls to understand the qualitative side that the numbers don't capture.
- Track ongoing filings for material changes, new debt, regulatory actions, and leadership changes that could affect the original analysis.
Limitations to Keep in Mind
Fundamental analysis tools are powerful, but they have real limitations worth acknowledging:
- They rely on historical and reported data, which may not reflect sudden shifts in business conditions.
- Ratios can be distorted by one-off events, accounting changes, or aggressive accounting practices.
- Tools differ in how they calculate certain metrics, so the same ratio can show slightly different values across platforms.
- Fundamental strength doesn't guarantee short-term price performance, since markets are also driven by sentiment, liquidity, and macroeconomic factors.


