Understanding Support and Resistance

Understanding Support and Resistance

The movement in the stock market may appear random initially; however, there could be a specific pattern in its movements because of demand and supply in the market. Among many other theories in the field of technical analysis, support and resistance are some of the most frequently used ones.

Whether you are just beginning your investment in the share market or trying to sharpen your investment strategy, understanding the support and resistance levels can greatly enhance your decision-making and lessen emotional trading.


In this guide, we’ll explore the meaning of the support and resistance indicator and how it works. So keep scrolling ahead!

What is Support and Resistance?

Support and Resistance are levels at which market activity tends to react owing to either buying or selling. 

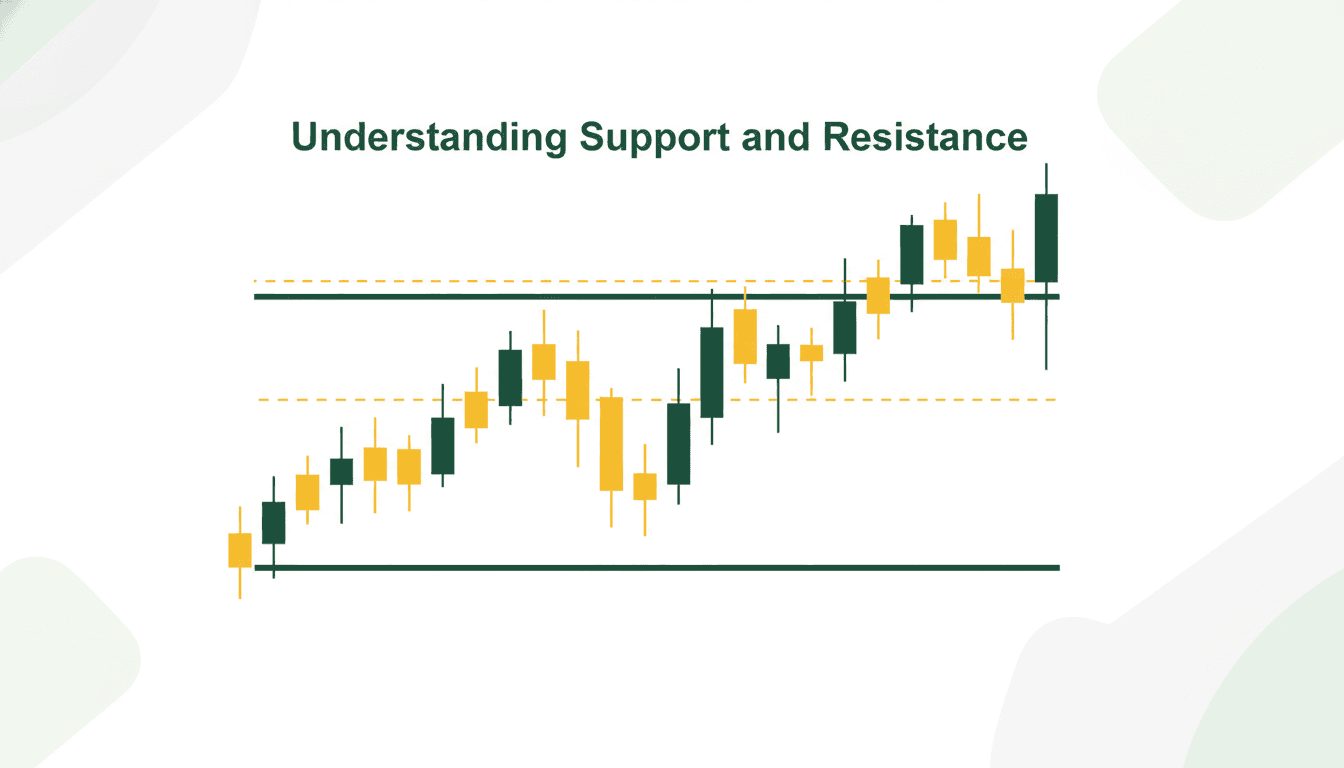
  • Support is a price level where demand tends to increase enough to slow or stop a decline. It acts like a floor where buyers may step in.
  • Resistance is a price level where selling pressure tends to increase enough to slow or stop a rise. It acts like a ceiling where sellers may emerge.

These levels are not always exact prices. In reality, they often behave as zones where multiple buyers or sellers become active.

For example, if a stock repeatedly falls near ₹500 and then rises, ₹500 might be viewed as a support level. If the same stock frequently rises near ₹550 and then drops, ₹550 might act as a resistance level.

Such zones reflect the collective psychology of traders. They remember how the prices responded earlier and tend to place their buying or selling orders at such levels again in the future. 

How Support Levels Work?

Support levels form when buyers believe a stock has become attractive at lower prices. As the price declines toward a certain zone, demand starts increasing, and selling pressure may weaken.


This creates a bounce or reversal from that level.


For example:

  • The share price declines from Rs. 800 to Rs. 720.
  • Buyers enter near ₹720 because they consider it a good value.
  • The stock rises again after touching that zone.
  • If this happens multiple times, ₹720 may be considered support.


Factors for strengthening the support levels include:

  • Repeated testing of the level
  • Large volumes witnessed near the zone 
  • Improve sentiment in the overall market
  • Favorable news for the buyers

However, support is not guaranteed. If strong selling pressure continues, the price can break below support and move lower.

How Resistance Levels Work?

Resistance develops when sellers become more active at higher prices. As the price moves higher towards a particular price, many investors may want to take their profit or sell what they own. Such behavior might result in a halt in the price movement or a change in the trend direction.

For instance:

  • A share goes up from ₹300 to ₹360.
  • There is a pattern of sellers reappearing at ₹360.
  • The price struggles to advance beyond that point.

In this case, ₹360 may become resistance.


Resistance becomes stronger when:


  • The price fails many times around the same level
  • Higher trading volumes occur around the area
  • Investors are booking profits
  • Market sentiment turns cautious

If buying pressure becomes strong enough, resistance can be broken, often leading to a fresh upward move.

Why Support and Resistance Are Important for Traders and Investors?

Support and resistance offer a realistic approach to trading and investing. Rather than making any arbitrary decisions, investors may rely on price behavior to make their moves.

1. Better Entry Points:

Many traders look for buying opportunities near support because downside risk may be relatively lower if the level holds.

2. Smarter Exit Decisions:

Resistance zones can help identify areas where price may face selling pressure, making them useful for profit booking.

3. Stop-Loss Placement:

Support and resistance also allow traders to place logical stop-loss orders. For instance, if a trader buys near the support level, he can place his stop-loss below the support level.

4. Trend Confirmation:

The breakout above resistance and below support, with good momentum, is indicative of trend continuation.

5. Reduced Emotional Decisions:

Using chart-based levels can improve discipline in share market investment decisions.

Different Types of Support and Resistance Levels

Support and resistance can appear in several forms.


1. Horizontal Support and Resistance: These are flat price zones formed by repeated highs or lows. They are among the easiest to identify.


2. Trendline Support and Resistance: In an uptrend, a rising trendline can act as support. In a downtrend, a falling trendline may act as resistance.


3. Moving Average Support and Resistance: Moving averages, like 50-day or 200-day averages, often act as dynamic levels. Many traders use them as a support and resistance indicator.


4. Psychological Levels: Round numbers like ₹100, ₹500, ₹1,000 often become important because many traders place orders there.


5. Fibonacci Levels: Fibonacci retracement levels are commonly used to estimate pullback support and resistance zones.

How to Identify Support and Resistance on a Chart?

Identifying the support and resistance levels needs observation and consistency. Here are common methods:

  • Historical Price Reactions: Look for zones where price has reversed multiple times in the past.
  • Swing Highs and Swing Lows: Previous highs often become resistance, while previous lows may act as support.
  • Volume Analysis: If a price level has strong volume activity, it may hold more importance.
  • Candlestick Behavior: Reversal candles, such as hammer, engulfing, or shooting star patterns near key zones, can provide confirmation.
  • Technical Indicators: Several tools can assist, such as:
  1. Moving averages
  2. Pivot points
  3. Bollinger Bands
  • Fibonacci retracement: These tools can act as a support and resistance indicator when used correctly.
  • Use Digital Platforms: Most modern charting platforms and any quality share market app allow drawing trendlines and marking levels for easier analysis.

How to Trade Using Support and Resistance?

Support and resistance can be used in multiple strategies.


1. Buying Near Support:

Some traders buy when the price approaches support and shows signs of bouncing. Example: If a stock repeatedly rebounds from ₹250, traders may look for buying setups near that level.


2. Selling Near Resistance:

Traders may reduce positions or book profits near resistance if the price shows weakness.


3. Breakout Trading:

When price moves strongly above resistance with volume, it may signal a bullish breakout. Similarly, a break below support may indicate bearish momentum.


4. Retest Strategy:

Sometimes, price breaks resistance, moves higher, then returns to test the old resistance. If it holds, that old resistance may become new support.


5. Risk Management Matters:

No level works every time. Always use stop losses and position sizing, especially in volatile stock market conditions.

Frequently Asked Questions

What is support and resistance in simple words?

Support is a level where the price may stop falling due to buying demand. Resistance is a level where the price may stop rising due to selling pressure.

Is support and resistance accurate?

These are probability-based zones, not guaranteed outcomes. They work best when combined with volume, trend, and risk management.

Which is the best support and resistance indicator?

There is no single best tool. Many traders use moving averages, pivot points, Fibonacci retracement, and trendlines.

Can beginners use support and resistance?

Yes. It is one of the easiest technical analysis concepts for beginners learning investment in share market strategies.

How can I track support and resistance easily?

You can use charting software or a reliable share market app that offers technical indicators and drawing tools.

Are support and resistance useful for long-term investors?

Yes. Even long-term investors can use these levels to plan better entry points during market corrections.

Disclaimer

The information provided in this article is for educational and informational purposes only. Any financial figures, calculations, or projections shared are solely intended to illustrate concepts and should not be construed as investment advice. All scenarios mentioned are hypothetical and are used only for explanatory purposes. The content is based on information from credible, publicly available sources. We do not guarantee the completeness, accuracy, or reliability of the data presented. Any references to the performance of indices, stocks, or financial products are purely illustrative and do not represent actual or future results. Actual investor experience may vary. Investors are advised to carefully read the scheme/product offering information document before making any decisions. Readers are advised to consult with a certified financial advisor before making any investment decisions. Neither the author nor the publishing entity shall be held responsible for any loss or liability arising from the use of this information.

Download TradeMobi App

Real-Time Market Data
Advanced Trading Tools
Expert-Backed Research
Google Play
App Store
TradeMobi

Popular on Anand Rathi

Explore Sitemap

Anand Rathi Share and Stock Brokers Ltd.
SEBI Registration No.: INZ000170832 (BSE-949 | NSE-06769 | MSEI-1014 | MCX-56185 | NCDEX-1252), CDSL & NSDL: IN-DP-437-2019. *Research Analyst - INH000000834. PMS: INP000000282 is Registered under "Anand Rathi Advisors Limited" | MBD-INM000010478 is Registered under "Anand Rathi Advisors Limited"| NBFC is Registered under "Anand Rathi Global Finance Limited" Regn. No.: B-13.01682 | Insurance is Registered under "Anand Rathi Insurance Brokers Ltd." License No. 175. Insurance Corporate Agent: CA1048 (This registration shall be valid from 04-Jun-2025 to 03-Jun-2028).

Anand Rathi International Ventures (IFSC) Private Limited.
SEBI Registration No.: INZ000292939 (INDIA INX Member Code: TM - 5064 | NSE IX Member Code: TM -10048, IIBX Member Code: TM – 2011), IIDI DP ID 350071 AND Registration No.: IFSCA/DP/2022-23/007, IFSCA/CMI/Distributor/2023-24/0002. CIN No.: U65999GJ2016PTC094915. For any complaints email at Ifscgrievance@rathi.com. Regulator: International Financial Services Centres Authority (IFSCA)- https://www.ifsca.gov.in/

Disclaimer:

Equity: Investment in securities market are subject to market risks, read all the related documents carefully before investing.

The securities are quoted as an example and not as a recommendation.

Mutual Funds: Mutual Fund investments are subject to market risks, read all scheme related documents carefully before Investing. AMFI-Registered Mutual Fund Distributor: ARN-4478 (Initial Registration 4th Feb, 2003 & Valid From 2nd April, 2025 - 1st April, 2028) : Anand Rathi Share and Stock Brokers Ltd. | ARN-111569: Anand Rathi Wealth Limited | ARN-100284: AR Digital Wealth Private Limited.

IPO: Opening of account will not guarantee allotment of shares in IPO. Investors are requested to do their own due diligence before investing in any IPO.

*Third Party products: All third-party products like PMS, Mutual Funds, Fixed Income Products, IBS, Bonds, AIFs are not Exchange traded product and "ARSSBL" is just acting as distributor. All disputes with respect to the distribution activity, would not have access to Exchange investor redressal forum or Arbitration mechanism.

MTF: MTF is subject to the provisions of SEBI Cir. CIR/MRD/DP/54/2017 dt June 13, 2017 & terms and conditions mentioned in rights and obligations statement issued by the ARSSBL

Investment Baskets: Baskets are not Exchange traded product, all disputes with respect to this activity, would not have access to Exchange investor redressal forum or Arbitration mechanism.

Research Analyst: The views expressed in this website accurately reflect the personal views of the analyst(s) about the subject securities or issuers and no part of the compensation of the research analyst(s) was, is, or will be directly or indirectly related to the specific recommendations or views expressed by the research analyst(s). The advertisment are bound by stringent internal regulations and also legal and statutory requirements of the Securities and Exchange Board of India (hereinafter "SEBI").

Certification: Registration granted by SEBI and certification from NISM is in no way a guarantee of performance of the intermediary or provides any assurance of returns to investors.

*Award Winning Research: Anand Rathi Share and Stock Brokers Limited (Research Analyst) was awarded as "Best Equity Advisor" at World BFSI Congress & Awards 2022

*Client Data: Client data shown on this website is as on 31st March 2025

Trading View: Anand Rathi has partnered with TradingView for its charting technology. A global platform offering heatmaps, STOCK SCREENERS and market data.

By submitting this form, I hereby provide my explicit consent to be contacted by Anand Rathi Group and its associate companies via phone call, SMS, email, or WhatsApp for information related to products and services, even if I am registered on DND.

Attention Investors:

  • For all communication related to vulnerability reporting, security alerts, or any other suspicious activity related to cyber security, contact priyanksheth@rathi.com/+91-22-62811514"
  • For any complaints email at grievance@rathi.com, For DP related queries/complaints email at dp@rathi.com
  • For any Mutual Fund-related complaints, please email customersupport@rathi.com.
  • For further escalation, you may contact mf@rathi.com.
  • Filing of complaints on SCORES – Easy & quick a. Register on SCORES portal b. Mandatory details for filing complaints on SCORES: I. Name, PAN, Address, Mobile Number, Email ID c. Benefits: I. Effective communication ii. Speedy redressal of the grievances.
  • Stock Brokers can accept securities as margin from clients only by way of pledge in the depository system w.e.f. September 1, 2020.
  • Update your mobile number & email Id with your stock broker/depository participant and receive OTP directly from depository on your email id and/or mobile number to create pledge.
  • Pay 20% upfront margin of the transaction value to trade in cash market segment.
  • Investors may please refer to the Exchange's Frequently Asked Questions (FAQs) issued vide circular reference NSE/INSP/45191 dated July 31, 2020 and NSE/INSP/45534 and BSE vide notice no. 20200731-7 dated July 31, 2020 and 20200831-45 dated August 31, 2020 dated August 31, 2020 and other guidelines issued from time to time in this regard
  • Check your Securities /MF/ Bonds in the consolidated account statement issued by NSDL/CDSL every month.
Prevent Unauthorized Transactions in your demat account → Update your Mobile Number with your Depository Participant. Receive alerts on your Registered Mobile for all debit and other important transactions in your demat account directly from CDSL.No need to issue cheques by investors while subscribing to IPO. Just write the bank account number and sign in the application form to authorise your bank to make payment in case of allotment. No worries for refund as the money remains in investor's account.KYC is one time exercise while dealing in securities markets - once KYC is done through a SEBI registered intermediary (broker, DP, Mutual Fund etc.), you need not undergo the same process again when you approach another intermediary.Prevent Unauthorized Transactions in your demat account → Update your Mobile Number with your Depository Participant. Receive alerts on your Registered Mobile for all debit and other important transactions in your demat account directly from CDSL.No need to issue cheques by investors while subscribing to IPO. Just write the bank account number and sign in the application form to authorise your bank to make payment in case of allotment. No worries for refund as the money remains in investor's account.KYC is one time exercise while dealing in securities markets - once KYC is done through a SEBI registered intermediary (broker, DP, Mutual Fund etc.), you need not undergo the same process again when you approach another intermediary.