

Commodity Markets Outlook Today
Gold is likely to trade with a slight downside bias today, holding below the $4,700/oz mark as elevated oil prices and ongoing US–Iran tensions keep inflation concerns firm. While geopolitical risks may support intermittent safe-haven demand, expectations of a prolonged higher-rate environment could cap gains. Overall, gold may trade in the $4,670–4,750/oz range, with pressure on the upside unless fresh escalation drives stronger buying.
Copper is expected to trade range-bound with a mild downside bias today, as US–Iran tensions keep sentiment cautious. The Fed’s likely pause in rates may limit sharp declines but also cap upside, reinforcing a “higher-for-longer” outlook. Strong Chinese demand offers support, though macro uncertainty could keep prices within the $13,200–13,500/ton range.
Oil’s near-term outlook remains firmly bullish but highly volatile as geopolitical risks dominate, with Brent crude likely to trade in a $103–$110 range and WTI crude in $94–$100. Sustained disruption in the Strait of Hormuz and hardening stance from Donald Trump keep a strong floor under prices, while lack of progress in U.S.-Iran talks limits downside. Immediate resistance is seen near $108–110 (Brent) and $98–100 (WTI), with support at $102–103 and $93–94 respectively.
| Commodity Moves | ||||||||||
| Commodity | Exchange | Expiry | Open | High | Low | Close | Net Chg | %Chg | Volume | Oi |
| US Gold | COMEX | Apr | 4,711.50 | 4,732.40 | 4,711.50 | 4,705.10 | (27.40) | -0.58 | 292 | 119 |
| INX Gold | India Inx | Apr | - | - | - | - | - | - | - | - |
| Gold | MCX | May | 1,52,051.00 | 1,53,003.00 | 1,51,268.00 | 1,51,761.00 | (896.00) | -0.59 | 5,383 | 8,291 |
| US Silver | COMEX | Apr | 76.31 | 76.33 | 76.26 | 75.47 | (2.43) | -3.12 | 21 | 15 |
| Silver | MCX | May | 2,42,501.00 | 2,46,968.00 | 2,39,600.00 | 2,41,513.00 | (6,851.00) | -2.76 | 9,545 | 5,354 |
| Bulldex | MCX | Apr | ||||||||
| London Copper | LME | 3M | 13,454.00 | 13,481.50 | 13,203.50 | 13,355.50 | (77.50) | -0.58 | 22,545 | - |
| Copper | MCX | Apr | 1,270.00 | 1,284.40 | 1,265.20 | 1,275.45 | (7.65) | -0.60 | 10,804 | 5,731 |
| Nickel | MCX | May | 1,716.10 | 1,734.00 | 1,716.10 | 1,732.30 | 4.70 | 0.27 | 261 | 442 |
| Zinc | MCX | Apr | 348.00 | 349.75 | 345.60 | 348.10 | (1.35) | -0.39 | 1,391 | 1,767 |
| Lead | MCX | Apr | 196.00 | 196.95 | 196.00 | 196.35 | (0.15) | -0.08 | 75 | 297 |
| Aluminium | MCX | Apr | 371.10 | 373.50 | 370.45 | 372.75 | (0.55) | -0.15 | 1,314 | 1,496 |
| Metldex | MCX | 0.00 | - | - | - | - | - | - | - | - |
| WTI Crude Oil | NYMEX | Jun | 92.90 | 98.39 | 92.30 | 95.85 | 2.89 | 3.11 | 3,65,210 | 3,10,051 |
| Brent Crude | ICE | Jun | 101.73 | 107.40 | 101.25 | 105.07 | 3.16 | 3.10 | 3,65,774 | - |
| Crudeoil | MCX | Jun | 8,799.00 | 9,246.00 | 8,700.00 | 9,175.00 | 452.00 | 5.18 | 85,789 | 12,099 |
| US Natural Gas | NYMEX | Oct | 2.72 | 2.74 | 2.57 | 2.61 | (0.11) | -3.97 | 79,279 | 32,355 |
| Natural Gas | MCX | Apr | 255.70 | 257.30 | 241.70 | 244.80 | (10.60) | -4.15 | 80,626 | 16,873 |
| Enrgdex | MCX | Apr |
Commodities in Focus
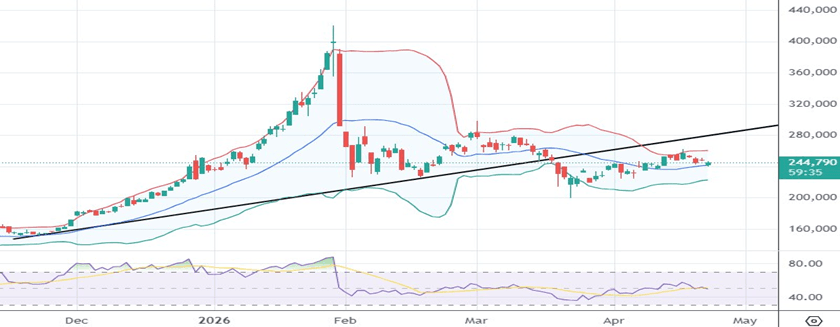
On the daily chart, MCX Silver (May) is currently trading with a sideways to mildly bearish bias after failing to sustain above the rising trend line, reinforcing the prevailing bearish market structure. Prices are also holding below the mean of the Bollinger Bands, indicating persistent negative sentiment and underlying weakness in the trend. Additionally, the RSI remains firmly below the 50 level, reflecting continued bearish momentum and suggesting limited upside in the near term. Considering the current technical setup, a sell-on-rise strategy is recommended.
| SILVER (MAY) |
| CMP Rs. 244790 |
| Trend: Sideways down |
| Immediate Support |
| 236200 |
| Strong Support |
| 229500 |
| Immediate Resistance |
| 248600 |
| Strong Resistance |
| 254900 |
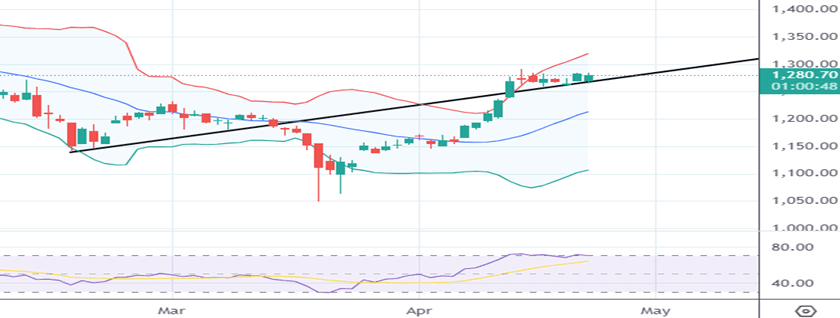
On the daily chart, MCX Copper (Apr) is displaying a sideways to mildly bullish bias, sustaining above a rising trend line that reinforces the prevailing bullish market structure. Prices continue to hold above the midpoint of the Bollinger Bands, indicating persistent positive sentiment and underlying strength in the trend. The RSI remains firmly above the 50 mark, reflecting sustained bullish momentum and suggesting limited downside risk in the near term. Given the current technical setup, a buy-on-dip strategy is advisable.
| COPPER (APRIL) |
| CMP Rs. 1280.70 |
| Trend: Sideways up |
| Immediate Support |
| 1272 |
| Strong Support |
| 1266 |
| Immediate Resistance |
| 1290 |
| Strong Resistance |
| 1297 |
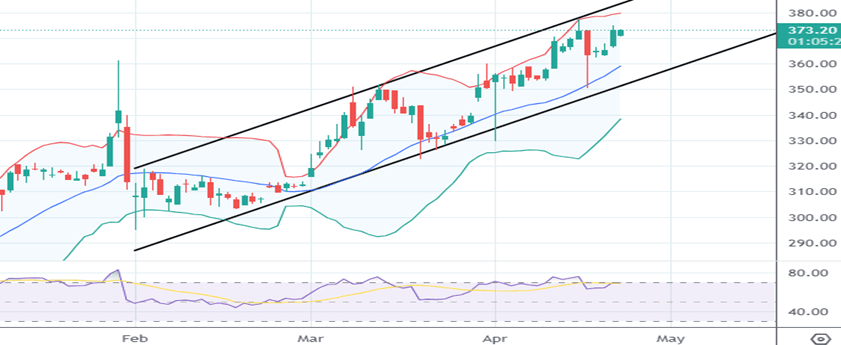
On the daily chart, MCX Aluminum (Apr) is exhibiting a sideways to mildly bullish bias, with prices trading within a rising channel that reinforces the prevailing positive market structure. The commodity continues to sustain above the midpoint of the Bollinger Bands, indicating persistent positive sentiment and underlying strength in the trend. Additionally, the RSI remains firmly positioned above the 50 level, reflecting sustained bullish momentum and suggesting limited downside risk in the near term. Given the current technical setup, a buy-on-dips strategy appears appropriate.
| ALUMINIUM (APRIL) |
| CMP Rs. 373.20 |
| Trend: Sideways up |
| Immediate Support |
| 369 |
| Strong Support |
| 365 |
| Immediate Resistance |
| 378 |
| Strong Resistance |
| 383 |