
Markets continued to gain momentum for the fifth consecutive week amid volatility. The bulls staged a smart comeback in the latter part of the week after taking support near 10,560 levels. Due to the recovery from the lower levels, Nifty index formed a hanging man candlestick pattern on the weekly scale which is considered as a bearish reversal pattern but still, we need a confirmation on the same, which will come if Nifty breaks the low of 10,560.
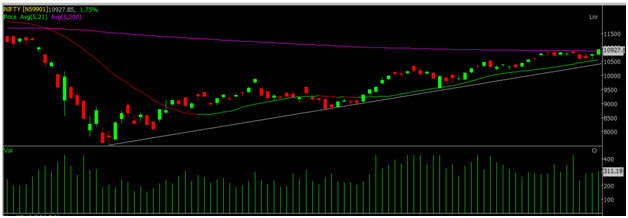
On the daily chart, the Nifty index surpassed its major hurdle of 200-DMA which is placed at 10,870 levels. It was earlier acting as major resistance and now it will act as immediate support.
As highlighted in the below chart, the Nifty index is taking support of its short term 21-DMA which is placed at 10,560 levels and if we take the retracement of the entire fall, then 61.8% retracement of the entire fall is placed at the same levels.
Now, as long as Nifty trades above 10,560 levels, we can expect the ongoing rally to continue towards 11,200 levels. A runaway gap is also seen at 11,200 levels and Nifty may make an attempt to fill the same. The momentum indicators and oscillators are still in the buy mode on a weekly scale which hints that bulls are tightening the grip.
The volatility index IndiaVIX fell by 3.5% and ended at 24.15 levels. As long as it trades below 30 levels, the bulls will have upper hand on the market.
The weekly options data indicates that a huge amount of put writing was seen in 10,700 and 10,800 strikes on Friday. The maximum open interest on the put side has shifted to 10,700 strikes, which holds the open interest of 27 lakh contracts and also likely to act as a major support in the coming week.
A huge amount of call writing was seen at 11,200 strikes which also holds the maximum open interest followed by 11,000 strikes. So the overall option data indicates that the bulls are having an upper hand and Nifty may trade in a broader range of 10,700 – 11,200.
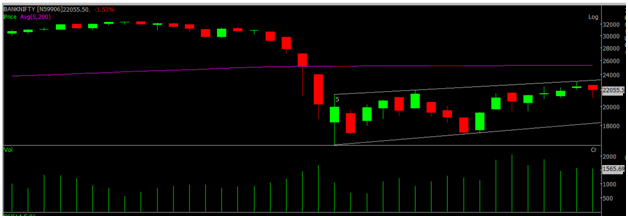
The BankNifty index underperformed compared to Nifty and also formed a hanging man candlestick pattern on the weekly scale. As highlighted in the below weekly chart, the BankNifty index is trading in a rising channel, where the upper end of the rising channel is placed at 23,200 levels which will act as immediate resistance and above that the upside may extend further towards 24,000 levels. On the flip side, 21,000 will be a major support for the BankNifty index.
On the weekly scale, the momentum indicator and oscillators are very well in the buy mode. Now, for Nifty to surpass the psychological barrier of 11,000 mark, Bank!ifty has to participate.
Author: Mr.Nilesh Ramesh Jain, Derivative and Technical Analyst (Investment Services), 18th July 2020.