
Nifty Outlook
- The bulls continued to dominate as both Nifty and BankNifty indices gained momentum for the fourth consecutive week. The Nifty index formed a small bullish candle and also reclaimed its 100-DEMA on the weekly scale.
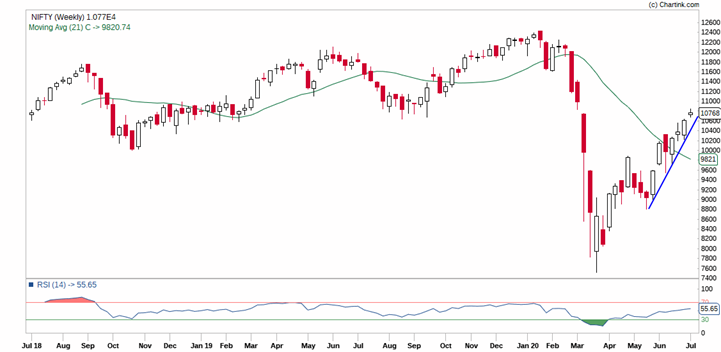
- As expected, Nifty also filled a gap which was placed at 10,800 levels. Now, if we take the Fibonacci retracement of the entire fall, then 78.6% retracement is coming around 11,350 levels. Whereas, the immediate support of a rising trend line is coming around 10500 levels and as long as Nifty trades above the same, we can expect the current momentum to continue towards 11,000 levels and above that the upside will open up for 11,350 levels.
- Now, as long as Nifty respects its rising trend line we can expect the ongoing rally to continue. The momentum indicators and oscillators are very well in the buy mode on a weekly scale which hints that bulls are still having an upper hand and current pullback is likely to extend further.
- The volatility index IndiaVIX fell by 3.6% and ended at a 4-month low of 24.8 levels. The overall fall in the volatility is hinting of no major move in the short term, which is giving comfort to the bulls.
- On the weekly expiry front, the options data indicates that the maximum open interest on the put side has shifted to 10,000 strikes which hold the maximum open interest of 22.7 lakh contracts. We have also seen fresh put writing at 10,700 strikes which holds the second-highest open interest and also likely to act as immediate support in the coming week.
- The call writers are scattered amongst 10,800, 10,900 and 11,000 strikes, where 10,800 holds the maximum open interest. So, the overall option data indicates a range-bound move in the coming week.
Nifty Weekly Chart
Bank Nifty Outlook
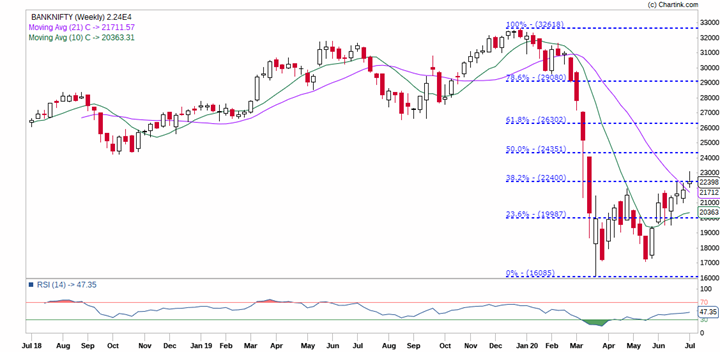
- The BankNifty index outperformed compared to the Nifty index on a weekly basis and reached its upper end of the rising channel.
- As highlighted in the below weekly chart, the Banknifty index is hovering near its 38.2% retracement of the entire fall which is placed at 22,400 levels. We have also witnessed profit booking from higher levels due to which Banknifty index formed a Doji candlestick pattern on the weekly scale which indicates indecisiveness amongst participants.
- On the upside, 23,000 will be a crucial resistance for the BankNifty index and only a move above the same might reflect the clear strength in the market. In case of any long positions, follow a strict stop loss of 21,800.
- Although on the weekly scale, the momentum indicator and oscillators are very well in the buy mode and to reclaim the positive momentum, it has to surpass its immediate hurdle of 23,000 levels and above that next resistance is placed at 24,000.
- So far we haven’t seen participation from Banknifty index hence, to gain further momentum in the Nifty index, Banknifty has to participate.
Bank Nifty Weekly Chart
Author: Mr.Nilesh Ramesh Jain, Derivative and Technical Analyst (Investment Services), 11th July 2020.